Spatio-temporal analysis for extreme temperature indices over the Levant region
Publication
Metrics
AI Quick Summary
This study analyzes the temporal and spatial trends of 16 extreme temperature indices in the Levant region from 1987-2016, revealing a significant warming trend, particularly in minimum temperatures, with 86% of stations showing increasing trends in annual SU25 and TR20 indices. Large-scale circulation patterns, notably the North Sea-Caspian pattern, were found to correlate significantly with these trends.
Paper Preview
Abstract
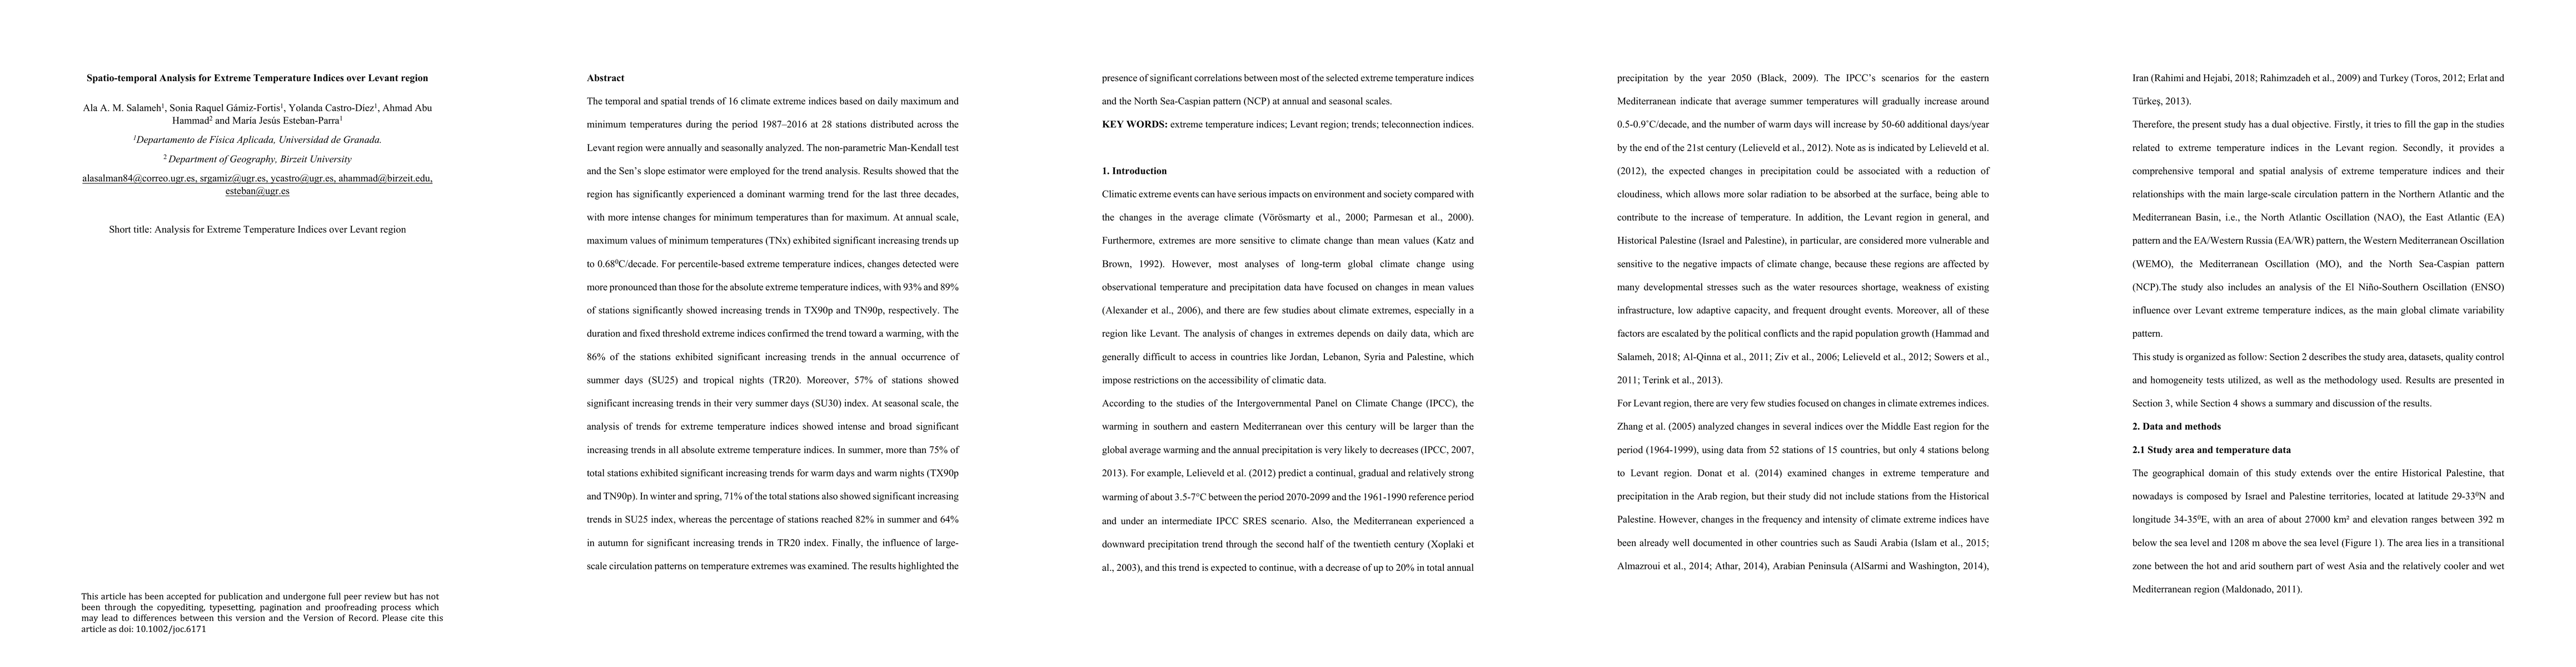
The temporal and spatial trends of 16 climate extreme indices based on daily maximum and minimum temperatures during the period 1987-2016 at 28 stations distributed across Israel and Palestine in the Levant region were annually and seasonally analysed. The Man-Kendall test and the Sen's slope estimator were employed for the trend analysis. Results showed that the region has significantly experienced a dominant warming trend for the last three decades, with more intense changes for minimum temperatures than for maximum. At annual scale, maximum values of minimum temperatures exhibited significant increasing trends up to 0.68{\deg}C/decade. Changes detected were more pronounced than those for the absolute extreme temperature indices, with 93 and 89% of stations significantly showed increasing trends in TX90p and TN90p, respectively. The duration and fixed threshold extreme indices confirmed the trend toward a warming, with the 86% of the stations exhibited significant increasing trends in the annual SU25 and TR20. Moreover, 57% of stations showed significant increasing trends in their SU30 index. At seasonal scale, the analysis of trends for extreme temperature indices showed intense and broad significant increasing trends in all absolute extreme temperature indices. In summer, more than 75% of total stations exhibited significant increasing trends for warm days and warm nights. In winter and spring, 71% of the total stations also showed significant increasing trends in SU25 index, whereas the percentage of stations reached 82% in summer and 64% in autumn for significant increasing trends in TR20 index. Finally, the influence of large-scale circulation patterns on temperature extremes was examined. The results highlighted the presence of significant correlations between most of the selected extreme temperature indices and the North Sea-Caspian pattern at annual and seasonal scales.
AI Key Findings
Get AI-generated insights about this paper's methodology, results, significance, and more — seven facets brought into focus.
Impact
Paper Details
Authors
PDF Preview
Key Terms
Citation Network
Current paper (gray), citations (green), references (blue)
Display is limited for performance on very large graphs.
Discussion 0