Spatio-Temporal Movements in Team Sports: A Visualization approach using Motion Charts
Publication
Metrics
AI Quick Summary
This paper proposes a visualization approach using GoogleVis R package's gvisMotionChart function to analyze and visualize spatio-temporal movements of players in team sports. A case study on a basketball match demonstrates the utility of this method in supporting preliminary analysis and interpretation of player trajectories.
Paper Preview
Abstract
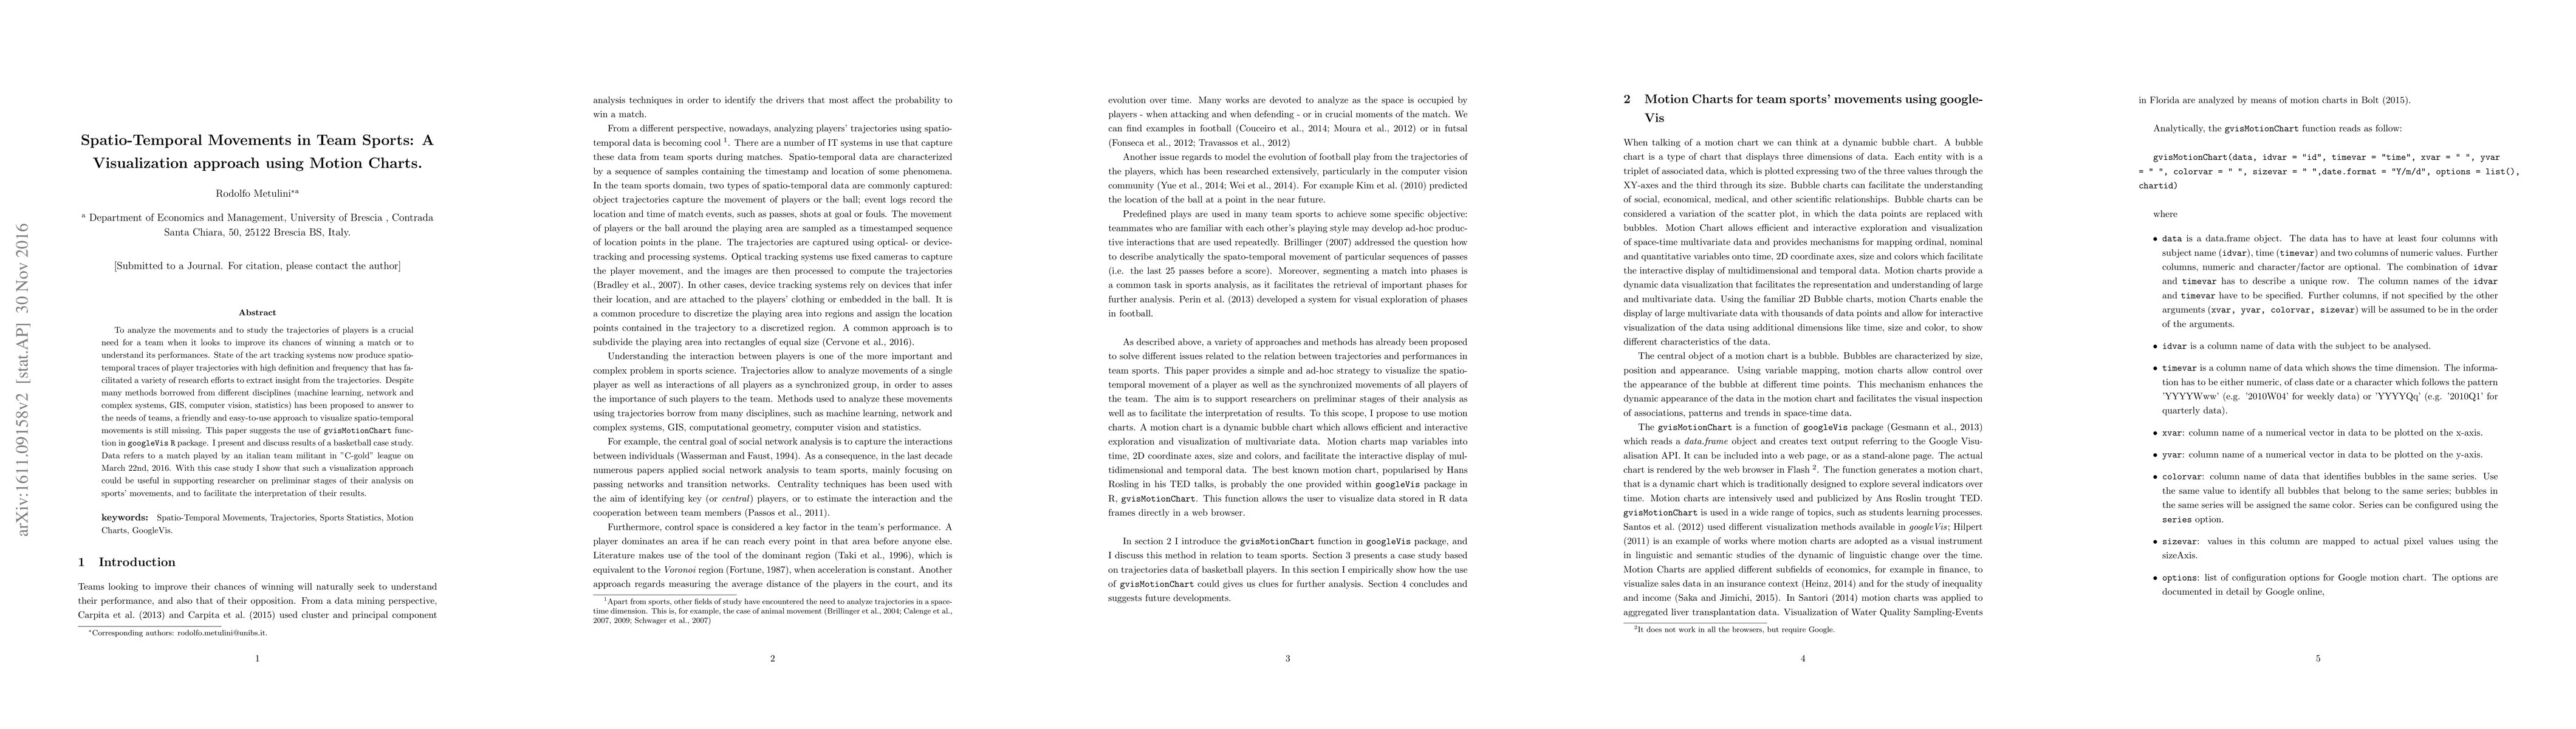
To analyze the movements and to study the trajectories of players is a crucial need for a team when it looks to improve its chances of winning a match or to understand its performances. State of the art tracking systems now produce spatio-temporal traces of player trajectories with high definition and frequency that has facilitated a variety of research efforts to extract insight from the trajectories. Despite many methods borrowed from different disciplines (machine learning, network and complex systems, GIS, computer vision, statistics) has been proposed to answer to the needs of teams, a friendly and easy-to-use approach to visualize spatio-temporal movements is still missing. This paper suggests the use of gvisMotionChart function in GoogleVis R package. I present and discuss results of a basketball case study. Data refers to a match played by an italian team militant in "C-gold" league on March 22nd, 2016. With this case study I show that such a visualization approach could be useful in supporting researcher on preliminar stages of their analysis on sports' movements, and to facilitate the interpretation of their results.
AI Key Findings
Get AI-generated insights about this paper's methodology, results, significance, and more — seven facets brought into focus.
Impact
Paper Details
PDF Preview
Key Terms
Citation Network
Current paper (gray), citations (green), references (blue)
Display is limited for performance on very large graphs.
Discussion 0