speckle-tracking: a Software Suite for Ptychographic X-ray Speckle Tracking
Publication
Metrics
AI Quick Summary
The paper introduces a software suite named "speckle-tracking" for ptychographic x-ray speckle tracking, providing rapid and robust characterization of x-ray wavefronts and sample properties. The software is implemented in Python 3 with GPU and multi-CPU support for efficient processing.
Paper Preview
Abstract
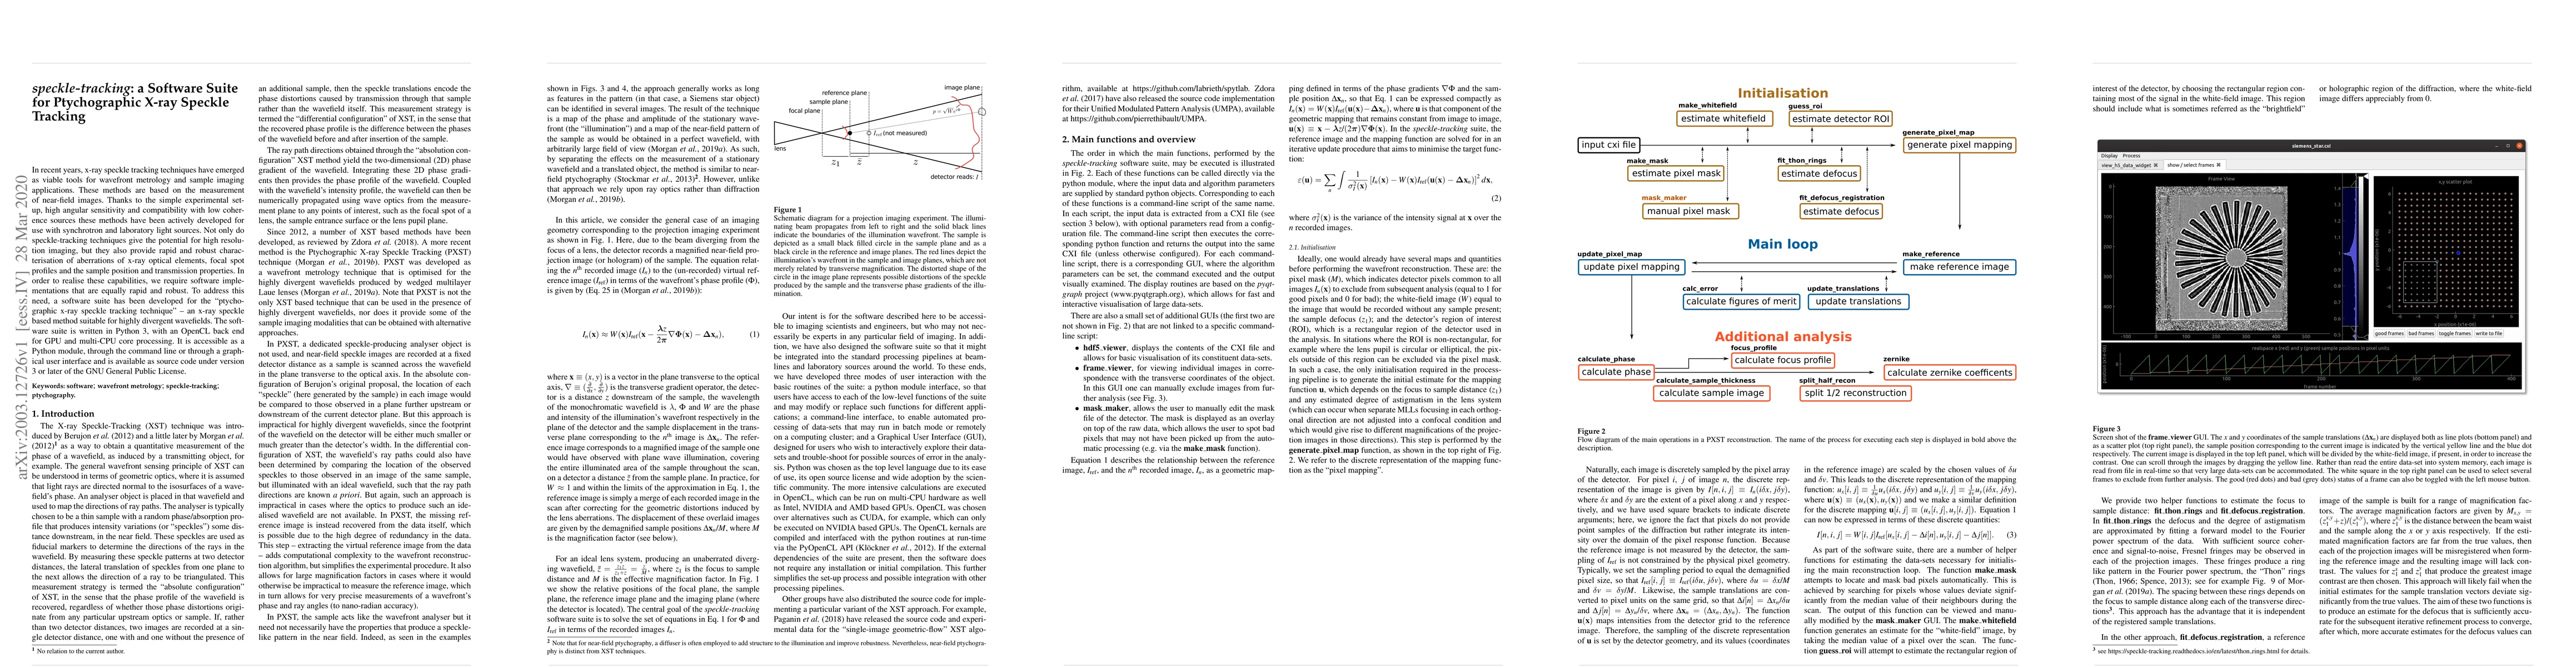
In recent years, x-ray speckle tracking techniques have emerged as viable tools for wavefront metrology and sample imaging applications. These methods are based on the measurement of near-field images. Thanks to the simple experimental set-up, high angular sensitivity and compatibility with low coherence sources these methods have been actively developed for use with synchrotron and laboratory light sources. Not only do speckle-tracking techniques give the potential for high resolution imaging, but they also provide rapid and robust characterisation of aberrations of x-ray optical elements, focal spot profiles and the sample position and transmission properties. In order to realise these capabilities, we require software implementations that are equally rapid and robust. To address this need, a software suite has been developed for the "ptychographic x-ray speckle tracking technique" -- an x-ray speckle based method suitable for highly divergent wavefields. The software suite is written in Python 3, with an OpenCL back end for GPU and multi-CPU core processing. It is accessible as a Python module, through the command line or through a graphical user interface and is available as source code under version 3 or later of the GNU General Public License.
AI Key Findings
Get AI-generated insights about this paper's methodology, results, significance, and more — seven facets brought into focus.
Impact
Paper Details
Authors
PDF Preview
Key Terms
Citation Network
Current paper (gray), citations (green), references (blue)
Display is limited for performance on very large graphs.
Discussion 0