Summary
The near-infrared spectral region is becoming a very useful wavelength range to detect and quantify the stellar population of galaxies. Models are developing to predict the contribution of TP-AGB stars, that should dominate the NIR spectra of populations 0.3 to 2 Gyr old. When present in a given stellar population, these stars leave unique signatures that can be used to detect them unambiguously. However, these models have to be tested in a homogeneous database of star-forming galaxies, to check if the results are consistent with what is found from different wavelength ranges. In this work we performed stellar population synthesis on the nuclear and extended regions of 23 star-forming galaxies to understand how the star-formation tracers in the near-infrared can be used in practice. The stellar population synthesis shows that for the galaxies with strong emission in the NIR, there is an important fraction of young/intermediate population contributing to the spectra, which is probably the ionisation source in these galaxies. Galaxies that had no emission lines measured in the NIR were found to have older average ages and less contribution of young populations. Although the stellar population synthesis method proved to be very effective to find the young ionising population in these galaxies, no clear correlation between these results and the NIR spectral indexes were found. Thus, we believe that, in practice, the use of these indexes is still very limited due to observational limitations.
AI Key Findings
Get AI-generated insights about this paper's methodology, results, and significance.
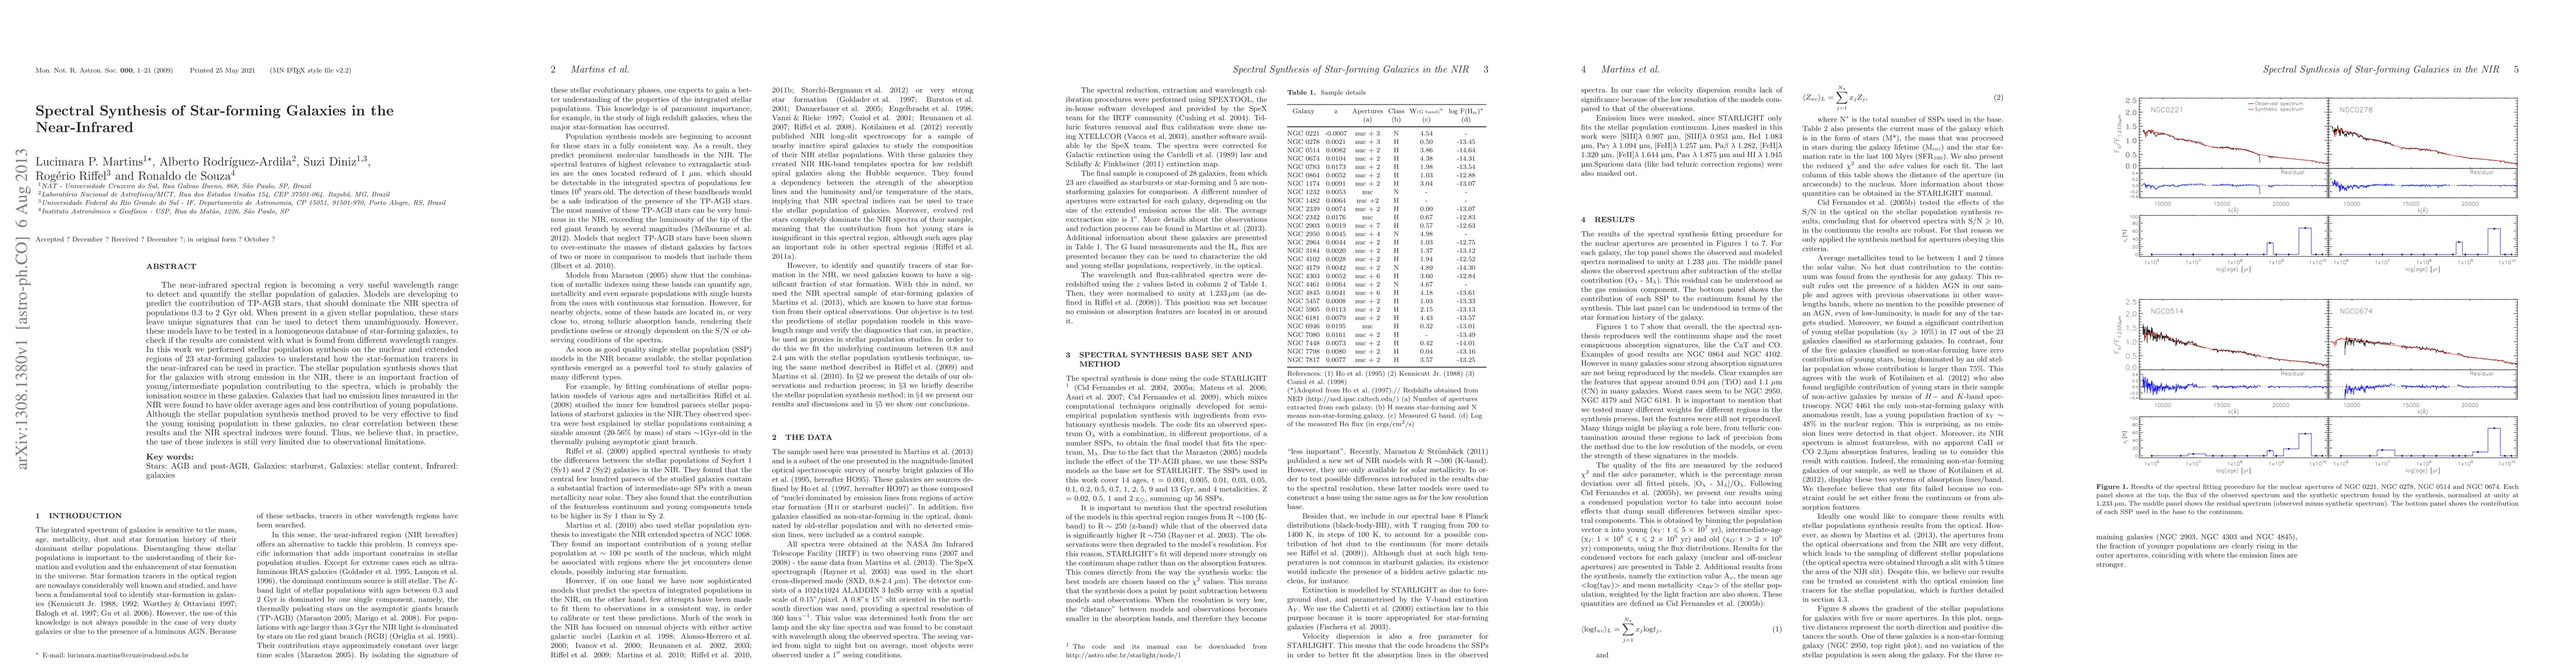
Paper Details
PDF Preview
Key Terms
Citation Network
Current paper (gray), citations (green), references (blue)
Display is limited for performance on very large graphs.
Similar Papers
Found 4 papers| Title | Authors | Year | Actions |
|---|
Comments (0)