Summary
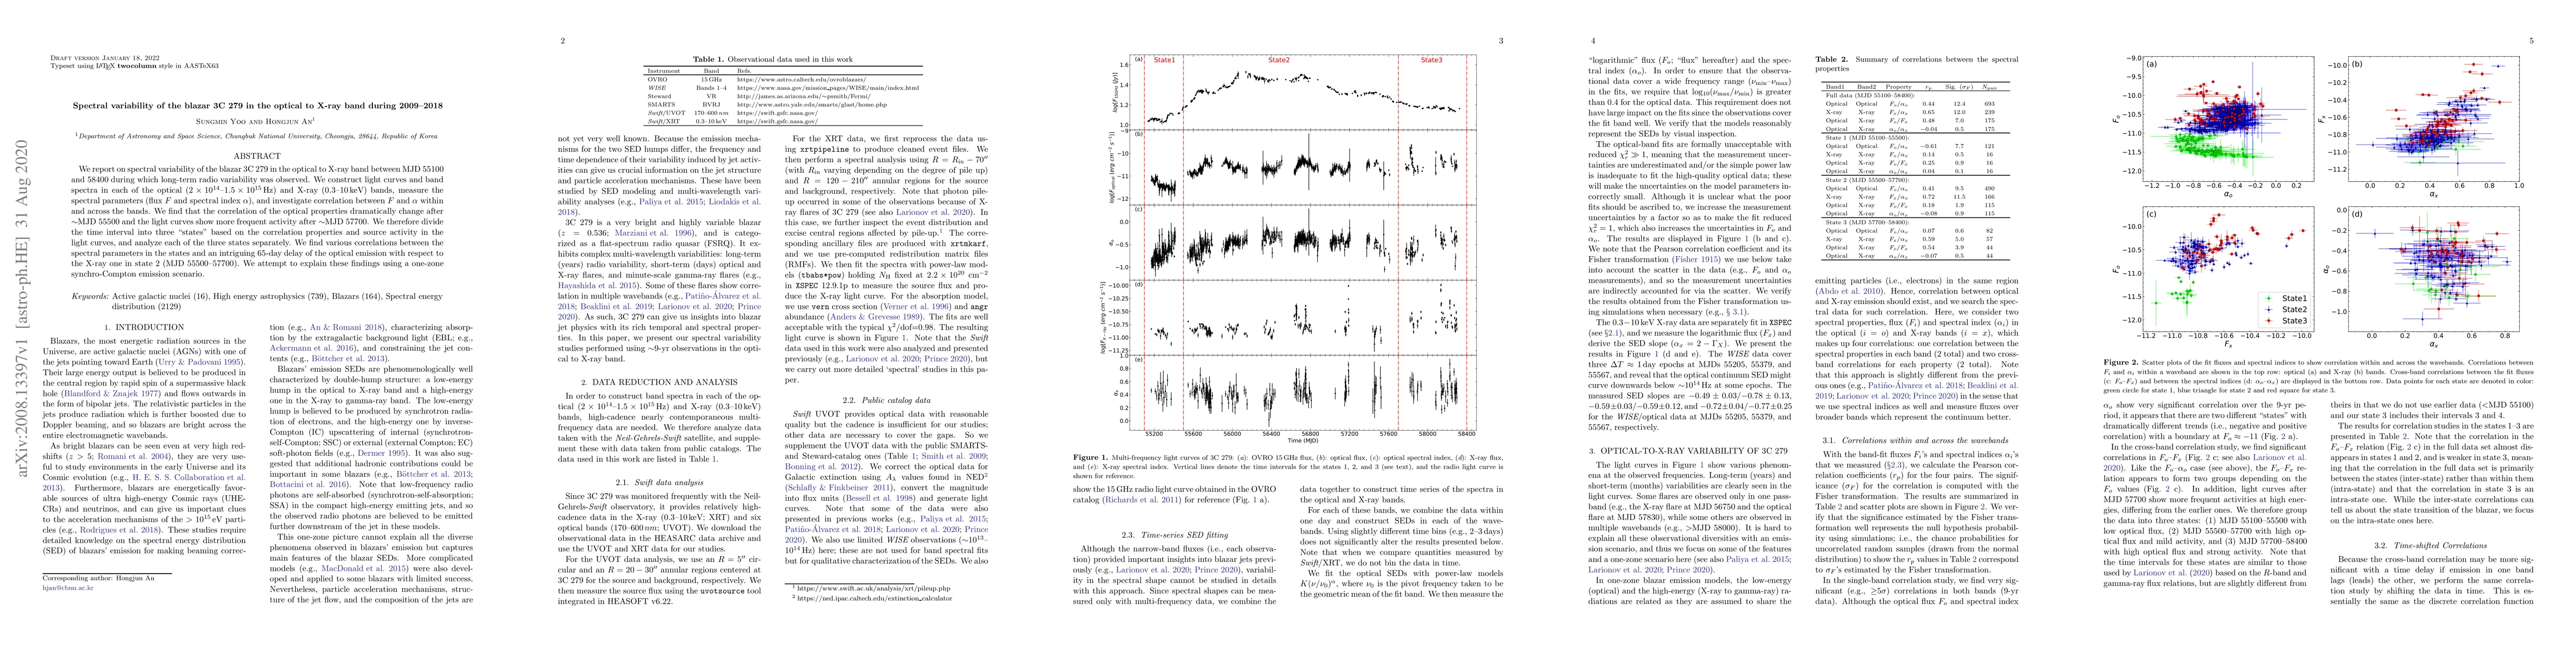
We report on spectral variability of the blazar 3C 279 in the optical to X-ray band between MJD 55100 and 58400 during which long-term radio variability was observed. We construct light curves and band spectra in each of the optical ($2\times10^{14}$-$1.5\times10^{15}$ Hz) and X-ray (0.3-10 keV) bands, measure the spectral parameters (flux $F$ and spectral index $\alpha$), and investigate correlation between $F$ and $\alpha$ within and across the bands. We find that the correlation of the optical properties dramatically change after $\sim$MJD 55500 and the light curves show more frequent activity after $\sim$MJD 57700. We therefore divide the time interval into three "states" based on the correlation properties and source activity in the light curves, and analyze each of the three states separately. We find various correlations between the spectral parameters in the states and an intriguing 65-day delay of the optical emission with respect to the X-ray one in state 2 (MJD 55500-57700). We attempt to explain these findings using a one-zone synchro-Compton emission scenario.
AI Key Findings
Get AI-generated insights about this paper's methodology, results, and significance.
Paper Details
PDF Preview
Key Terms
Citation Network
Current paper (gray), citations (green), references (blue)
Display is limited for performance on very large graphs.
| Title | Authors | Year | Actions |
|---|
Comments (0)