SpectraPlot.com: Integrated Spectroscopic Modeling of Atomic and Molecular Gases
Publication
Metrics
Paper Preview
Abstract
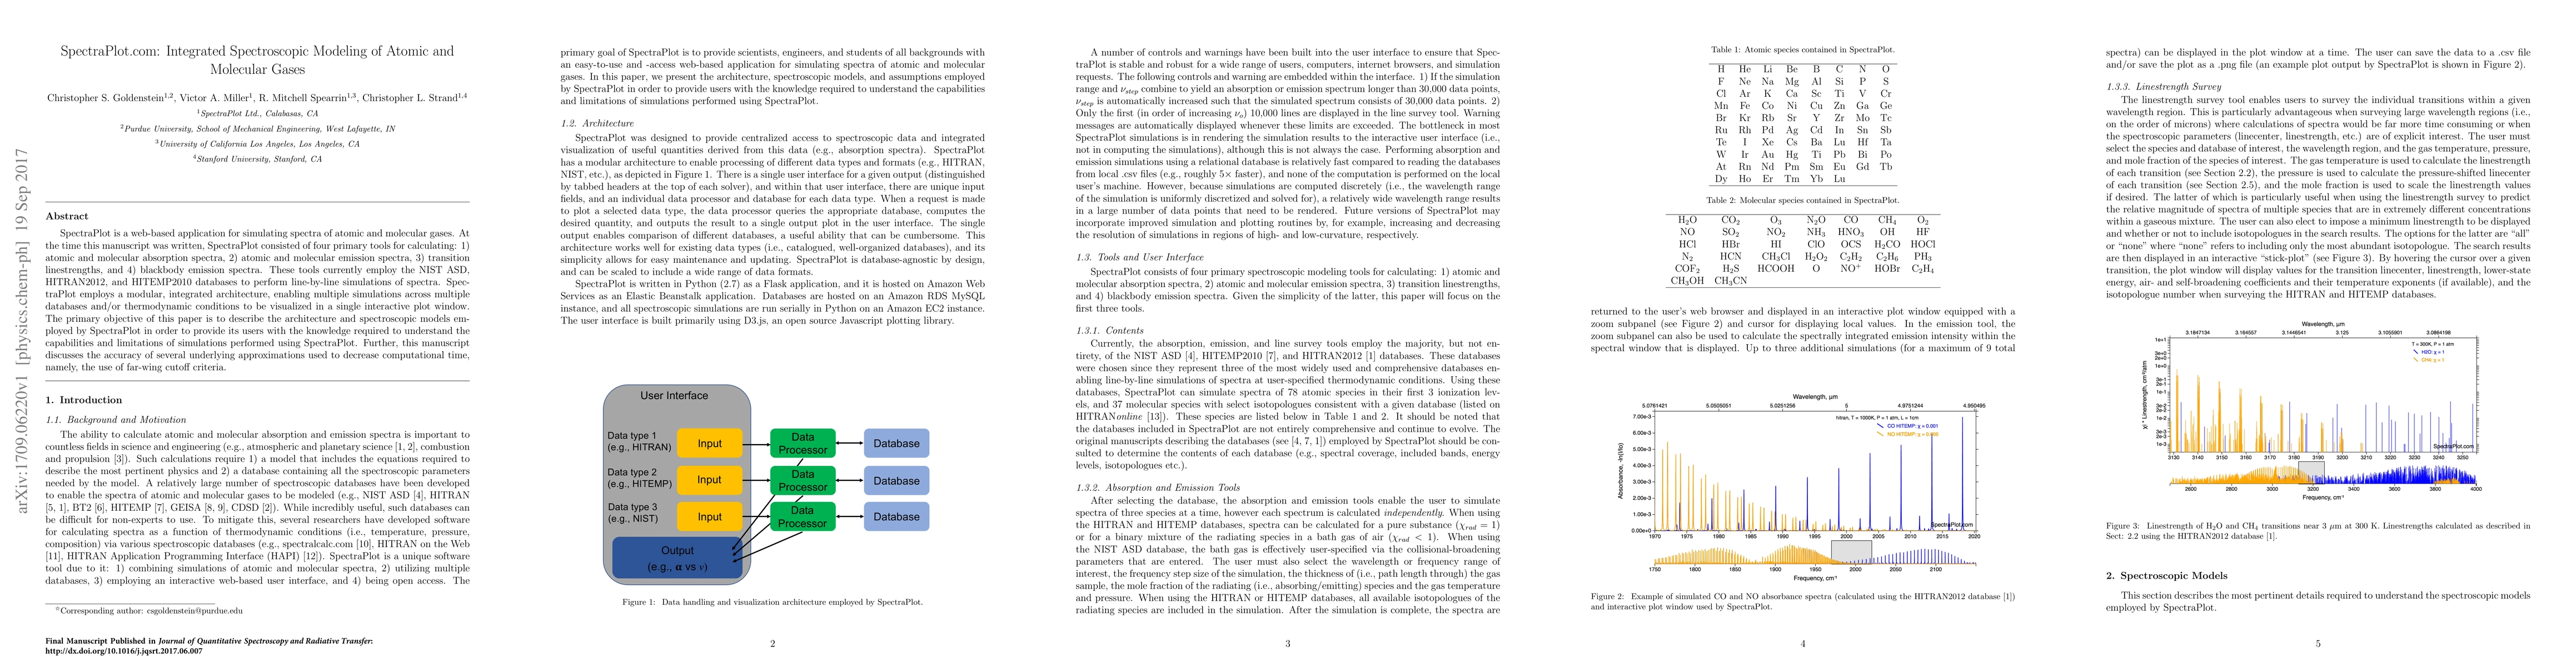
SpectraPlot is a web-based application for simulating spectra of atomic and molecular gases. At the time this manuscript was written, SpectraPlot consisted of four primary tools for calculating: 1) atomic and molecular absorption spectra, 2) atomic and molecular emission spectra, 3) transition linestrengths, and 4) blackbody emission spectra. These tools currently employ the NIST ASD, HITRAN2012, and HITEMP2010 databases to perform line-by-line simulations of spectra. SpectraPlot employs a modular, integrated architecture, enabling multiple simulations across multiple databases and/or thermodynamic conditions to be visualized in a single interactive plot window. The primary objective of this paper is to describe the architecture and spectroscopic models employed by SpectraPlot in order to provide its users with the knowledge required to understand the capabilities and limitations of simulations performed using SpectraPlot. Further, this manuscript discusses the accuracy of several underlying approximations used to decrease computational time, namely, the use of far-wing cutoff criteria.
AI Key Findings
Get AI-generated insights about this paper's methodology, results, significance, and more — seven facets brought into focus.
Impact
Paper Details
PDF Preview
Key Terms
Citation Network
Current paper (gray), citations (green), references (blue)
Display is limited for performance on very large graphs.
Discussion 0