Publication
Metrics
Paper Preview
Abstract
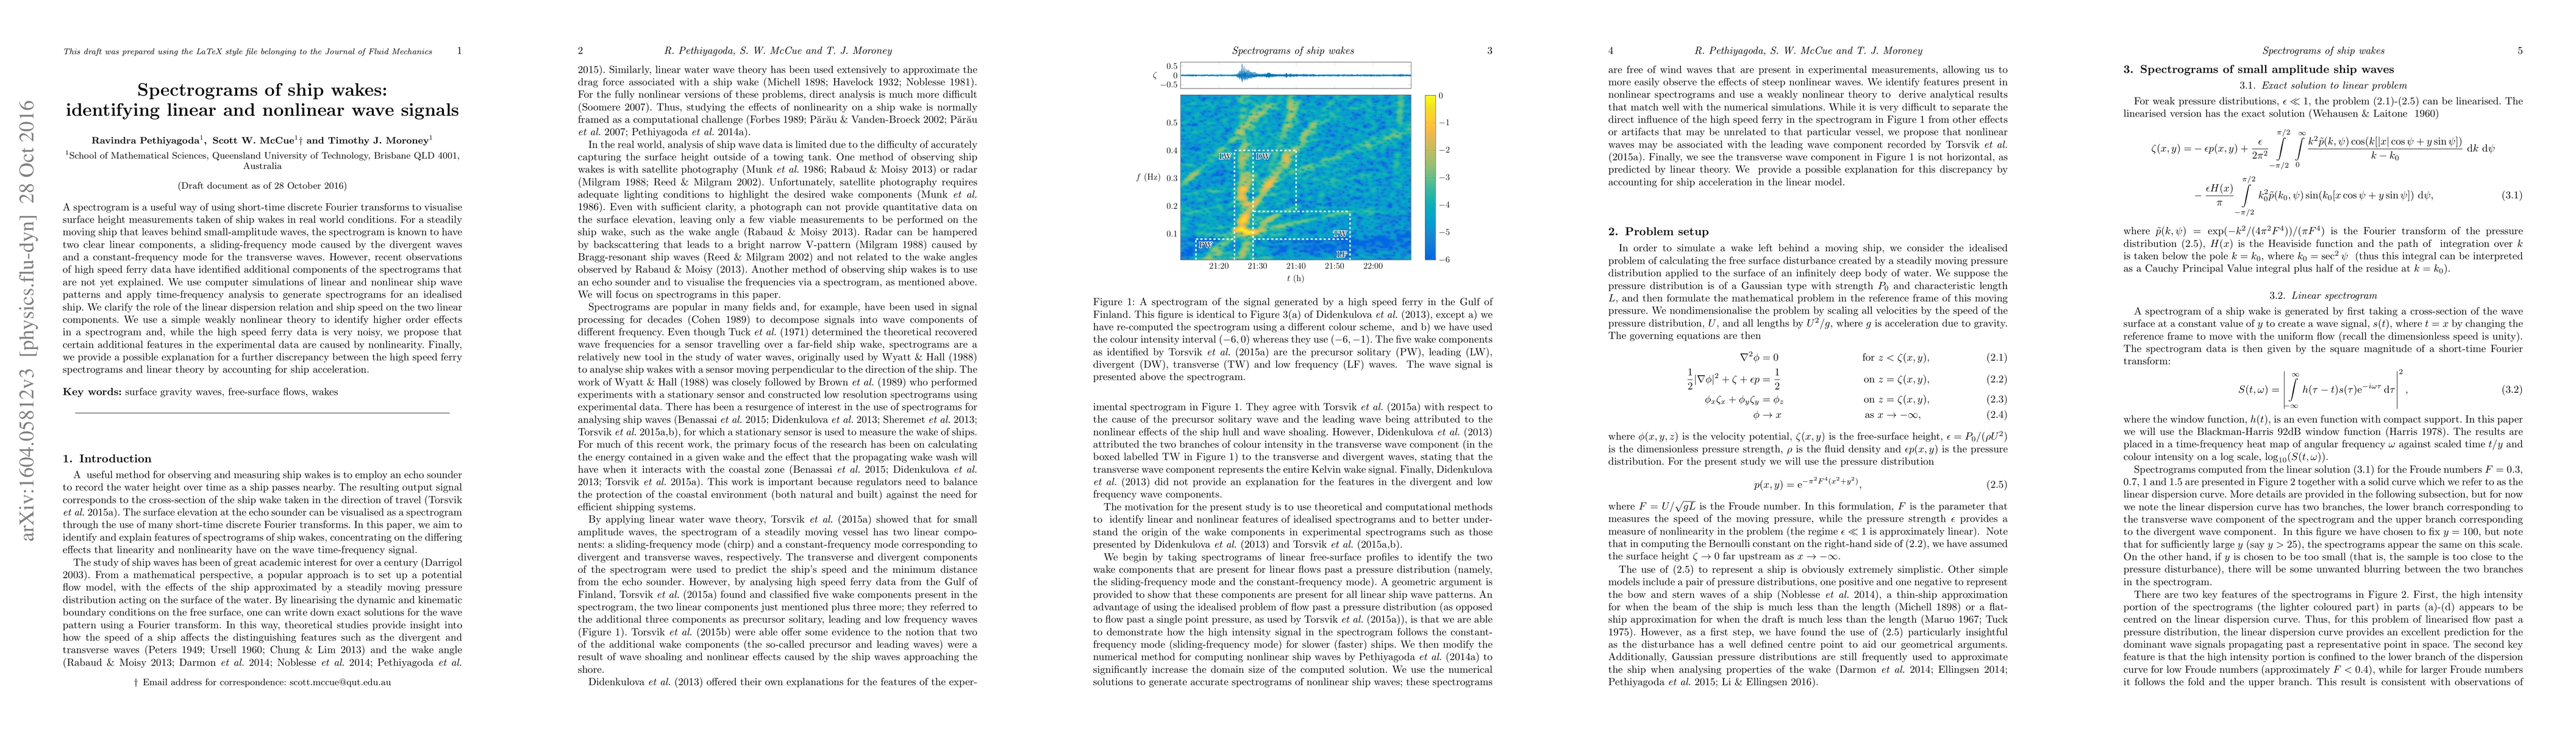
A spectrogram is a useful way of using short-time discrete Fourier transforms to visualise surface height measurements taken of ship wakes in real world conditions. For a steadily moving ship that leaves behind small-amplitude waves, the spectrogram is known to have two clear linear components, a sliding-frequency mode caused by the divergent waves and a constant-frequency mode for the transverse waves. However, recent observations of high speed ferry data have identified additional components of the spectrograms that are not yet explained. We use computer simulations of linear and nonlinear ship wave patterns and apply time-frequency analysis to generate spectrograms for an idealised ship. We clarify the role of the linear dispersion relation and ship speed on the two linear components. We use a simple weakly nonlinear theory to identify higher order effects in a spectrogram and, while the high speed ferry data is very noisy, we propose that certain additional features in the experimental data are caused by nonlinearity. Finally, we provide a possible explanation for a further discrepancy between the high speed ferry spectrograms and linear theory by accounting for ship acceleration.
AI Key Findings
Get AI-generated insights about this paper's methodology, results, significance, and more — seven facets brought into focus.
Impact
Paper Details
PDF Preview
Key Terms
Citation Network
Current paper (gray), citations (green), references (blue)
Display is limited for performance on very large graphs.
Discussion 0