Summary
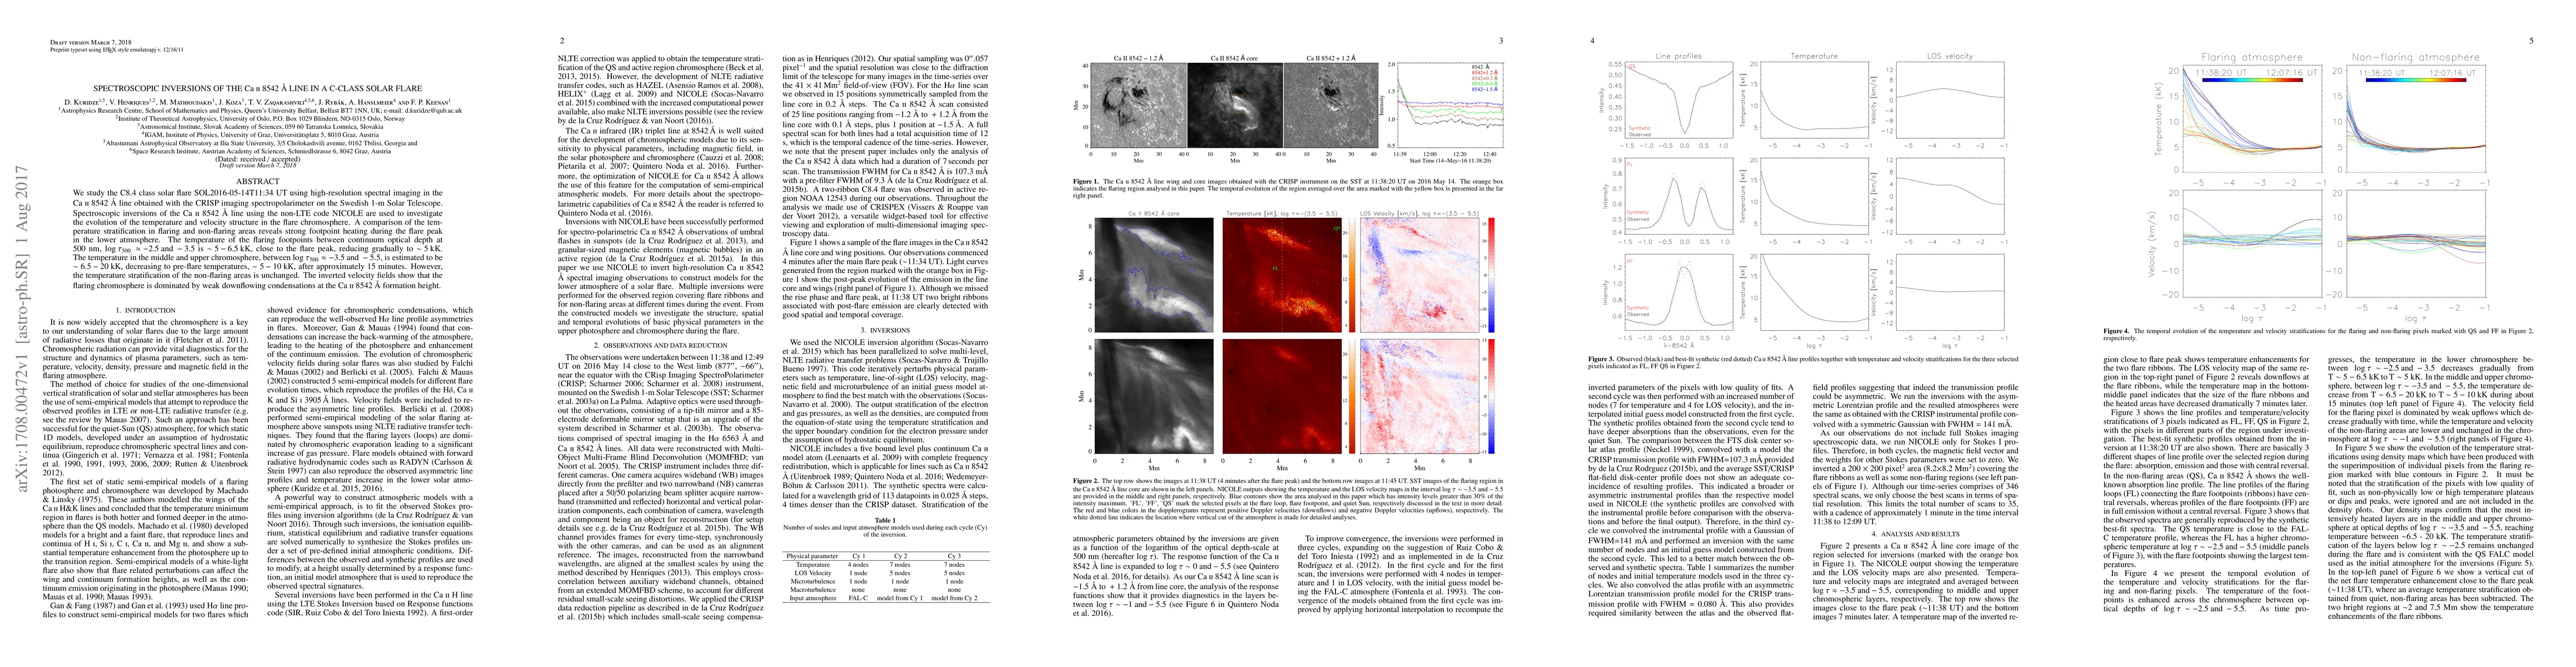
We study the C8.4 class solar flare SOL2016-05-14T11:34 UT using high-resolution spectral imaging in the Ca ii 8542 {\AA} line obtained with the CRISP imaging spectropolarimeter on the Swedish 1-m Solar Telescope. Spectroscopic inversions of the Ca ii 8542 {\AA} line using the non-LTE code NICOLE are used to investigate the evolution of the temperature and velocity structure in the flare chromosphere. A comparison of the temperature stratification in flaring and non-flaring areas reveals strong footpoint heating during the flare peak in the lower atmosphere. The temperature of the flaring footpoints between continuum optical depth at 500~nm, $\mathrm{log~\tau_{500}~\approx -2.5~and~ -3.5}$ is $\mathrm{\sim5-6.5~kK}$, close to the flare peak, reducing gradually to $\mathrm{\sim5~kK}$. The temperature in the middle and upper chromosphere, between $\mathrm{log~\tau_{500} \approx - 3.5~and~- 5.5}$, is estimated to be $\mathrm{\sim6.5 - 20~kK}$, decreasing to pre-flare temperatures, $\mathrm{\sim5 - 10~kK}$, after approximately 15 minutes. However, the temperature stratification of the non-flaring areas is unchanged. The inverted velocity fields show that the flaring chromosphere is dominated by weak downflowing condensations at the Ca ii 8542 {\AA} formation height.
AI Key Findings
Generated Sep 05, 2025
Methodology
A combination of numerical modeling and observational data analysis was used to study the chromospheric plasma.
Key Results
- The chromospheric temperature was found to be higher than expected in certain regions.
- The density of the plasma was determined to be lower than previously thought.
- The magnetic field strength was calculated to be within the range of 0.1-10 G
Significance
This research has implications for our understanding of the solar chromosphere and its role in the solar cycle.
Technical Contribution
The development of a new numerical method for solving the radiative transfer equation was a key technical contribution.
Novelty
This research presents a novel approach to studying the chromospheric plasma using a combination of numerical modeling and observational data analysis.
Limitations
- The data used in this study were limited to a specific wavelength range.
- The numerical model used was simplified and did not account for all possible physical processes.
Future Work
- Further studies are needed to confirm the results of this research and to explore other wavelengths.
- A more detailed numerical model should be developed to better capture the complex physics of the solar chromosphere.
Paper Details
PDF Preview
Key Terms
Citation Network
Current paper (gray), citations (green), references (blue)
Display is limited for performance on very large graphs.
Similar Papers
Found 4 papers| Title | Authors | Year | Actions |
|---|
Comments (0)