Spectroscopic study of late-type emission-line stars using the data from LAMOST DR6
Publication
Metrics
AI Quick Summary
This study catalogs 38,152 late-type emission-line stars (F0 to M9) identified from LAMOST DR6 data, utilizing Python for spectral analysis to locate H-alpha peaks. The sample is classified into various evolutionary stages, with 29,222 new detections, and includes measurements of emission line strengths, contributing valuable data for studying stellar activity.
Paper Preview
Abstract
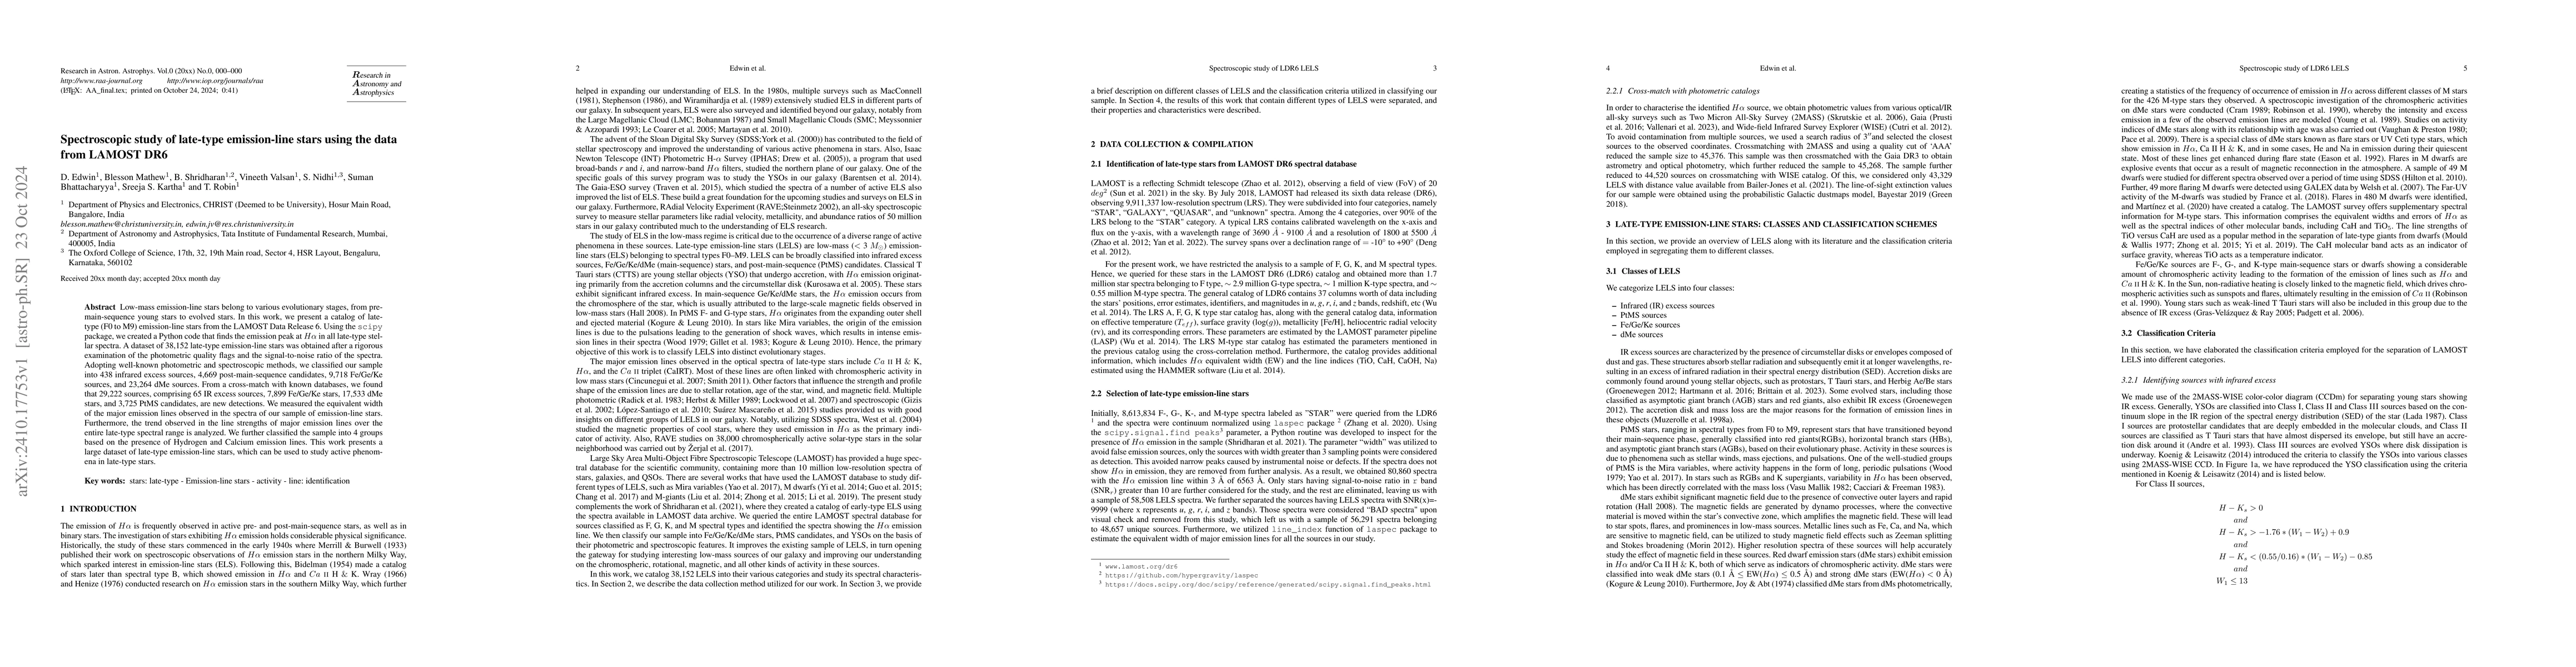
Low-mass emission-line stars belong to various evolutionary stages, from pre-main-sequence young stars to evolved stars. In this work, we present a catalog of late-type (F0 to M9) emission-line stars from the LAMOST Data Release 6. Using the scipy package, we created a Python code that finds the emission peak at H-alpha in all late-type stellar spectra. A dataset of 38,152 late-type emission-line stars was obtained after a rigorous examination of the photometric quality flags and the signal-to-noise ratio of the spectra. Adopting well-known photometric and spectroscopic methods, we classified our sample into 438 infrared excess sources, 4,669 post-main-sequence candidates, 9,718 Fe/Ge/Ke sources, and 23,264 dMe sources. From a cross-match with known databases, we found that 29,222 sources, comprising 65 IR excess sources, 7,899 Fe/Ge/Ke stars, 17,533 dMe stars, and 3,725 PtMS candidates, are new detections. We measured the equivalent width of the major emission lines observed in the spectra of our sample of emission-line stars. Furthermore, the trend observed in the line strengths of major emission lines over the entire late-type spectral range is analyzed. We further classified the sample into 4 groups based on the presence of Hydrogen and Calcium emission lines. This work presents a large dataset of late-type emission-line stars, which can be used to study active phenomena in late-type stars.
AI Key Findings
Get AI-generated insights about this paper's methodology, results, significance, and more — seven facets brought into focus.
Impact
Paper Details
Authors
PDF Preview
Citation Network
Current paper (gray), citations (green), references (blue)
Display is limited for performance on very large graphs.
Discussion 0