Summary
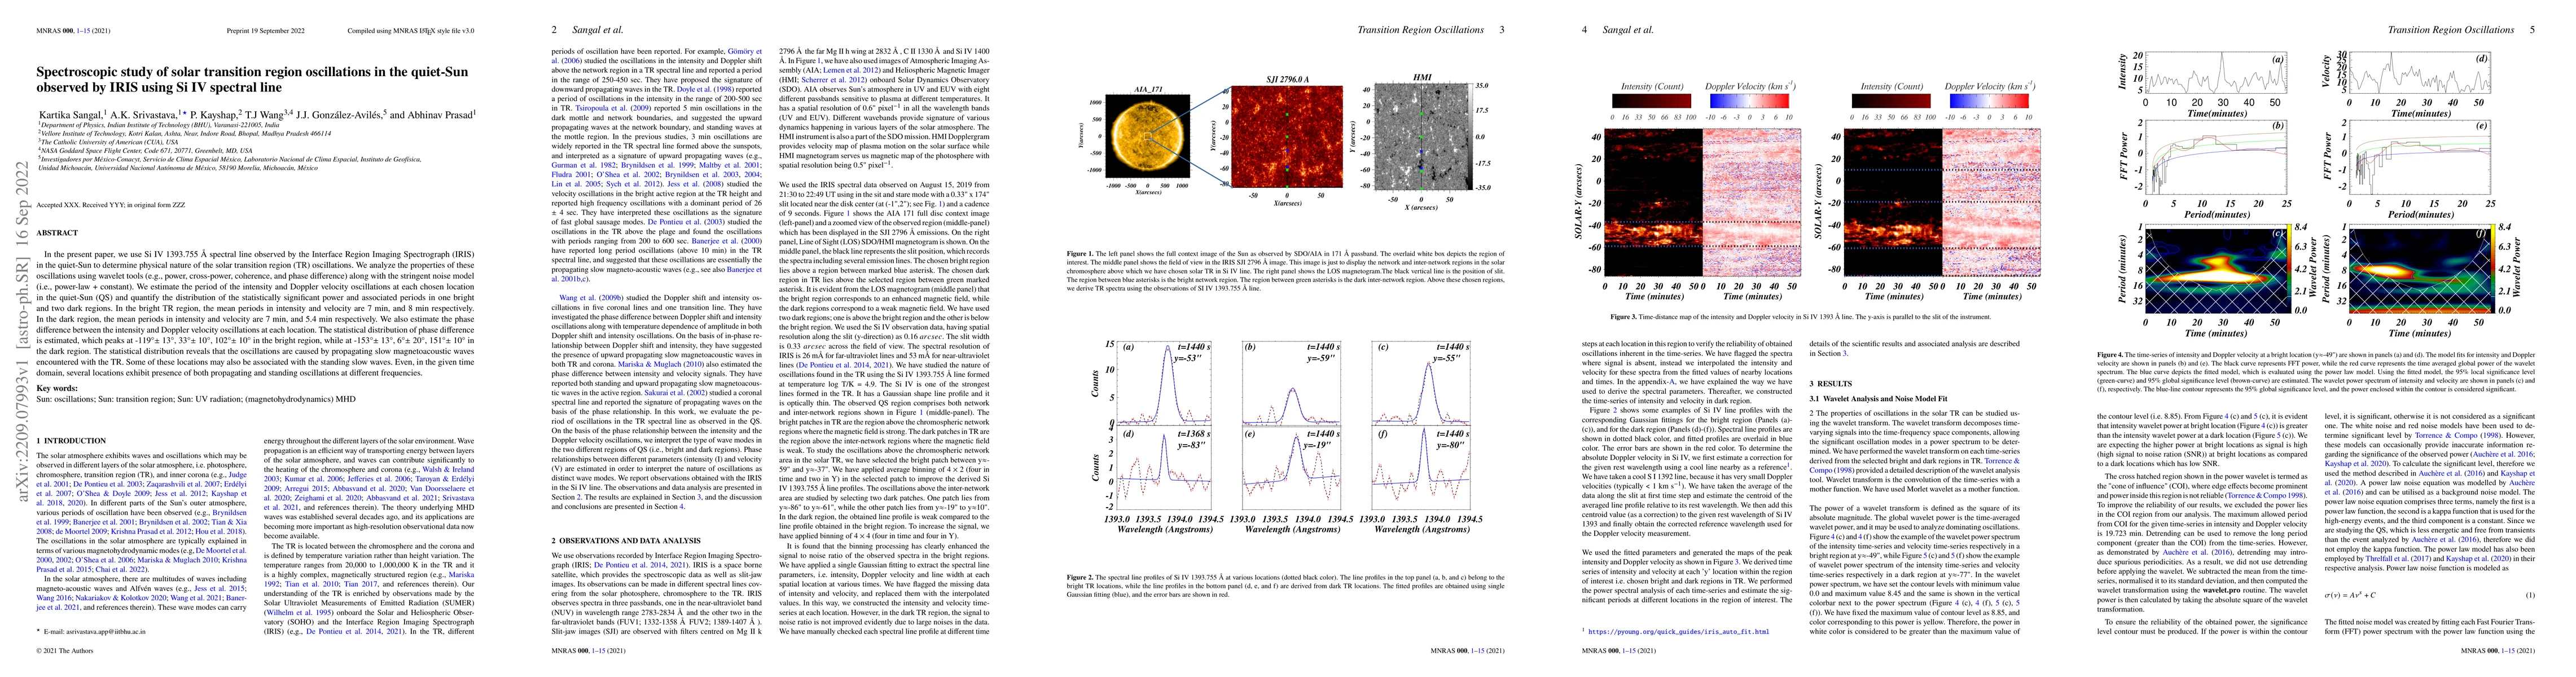
In the present paper, we use Si IV 1393.755 \AA\ spectral line observed by the Interface Region Imaging Spectrograph (IRIS) in the quiet-Sun to determine physical nature of the solar transition region (TR) oscillations. We analyze the properties of these oscillations using wavelet tools (e.g., power, cross-power, coherence, and phase difference) along with the stringent noise model (i.e., power-law + constant). We estimate the period of the intensity and Doppler velocity oscillations at each chosen location in the quiet-Sun (QS) and quantify the distribution of the statistically significant power and associated periods in one bright and two dark regions. In the bright TR region, the mean periods in intensity and velocity are 7 min, and 8 min respectively. In the dark region, the mean periods in intensity and velocity are 7 min, and 5.4 min respectively. We also estimate the phase difference between the intensity and Doppler velocity oscillations at each location. The statistical distribution of phase difference is estimated, which peaks at -119\degree $\pm$ 13\degree, 33\degree $\pm$ 10\degree, 102\degree $\pm$ 10\degree\ in the bright region, while at -153\degree $\pm$ 13\degree, 6\degree $\pm$ 20\degree, 151\degree $\pm$ 10\degree\ in the dark region. The statistical distribution reveals that the oscillations are caused by propagating slow magnetoacoustic waves encountered with the TR. Some of these locations may also be associated with the standing slow waves. Even, in the given time domain, several locations exhibit presence of both propagating and standing oscillations at different frequencies.
AI Key Findings
Get AI-generated insights about this paper's methodology, results, and significance.
Paper Details
PDF Preview
Key Terms
Citation Network
Current paper (gray), citations (green), references (blue)
Display is limited for performance on very large graphs.
Similar Papers
Found 4 papersStatistical investigation of wave propagation in the quiet-Sun using IRIS spectroscopic observations
A. K. Srivastava, Ding Yuan, E. Scullion et al.
Transition region response to Quiet Sun Ellerman Bombs
Aditi Bhatnagar, Luc Rouppe van der Voort, Jayant Joshi
| Title | Authors | Year | Actions |
|---|
Comments (0)