Authors
Summary
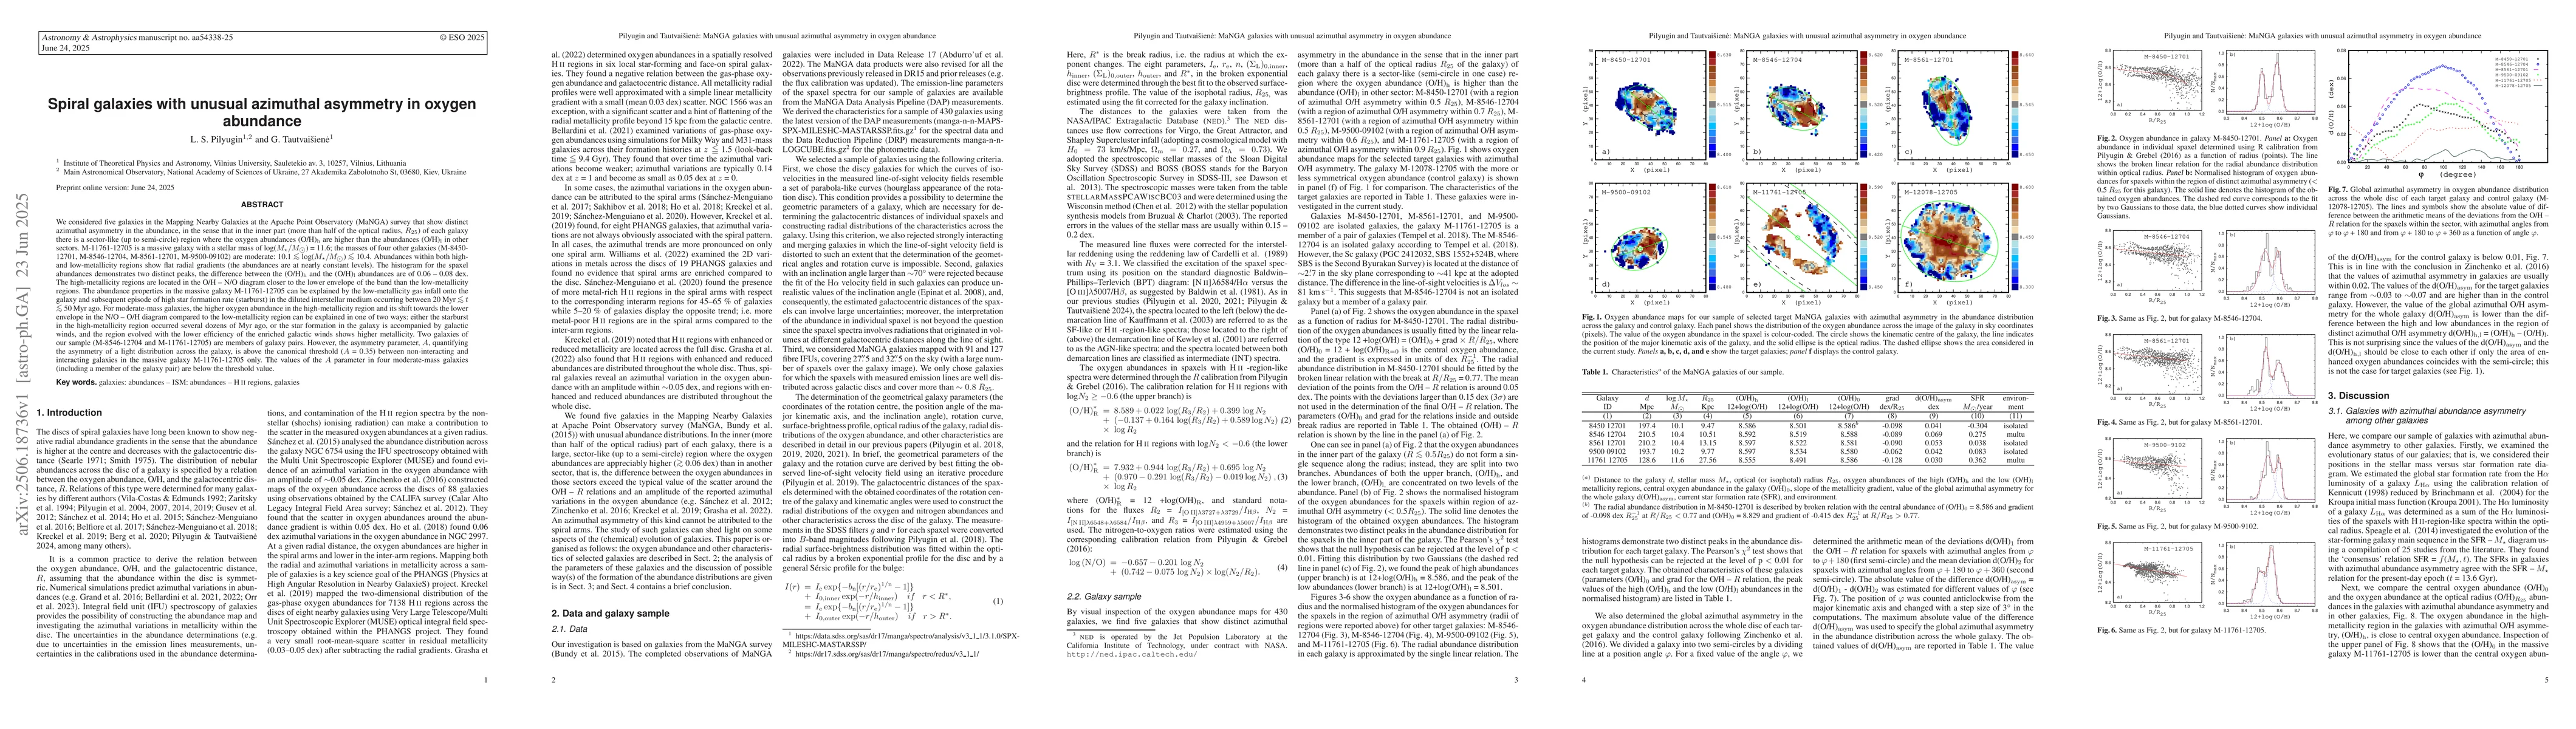
We considered five galaxies in the MaNGA survey that show distinct azimuthal asymmetry in the abundance, in the sense that in the inner part (more than half of the optical radius, $R_{25}$) of each galaxy there is a sector-like region where the oxygen abundances (O/H)_h are higher than the abundances (O/H)_l in other sectors. M-11761-12705 is a massive galaxy with a stellar mass of log(M_star/M_sun) = 11.6; the masses of four other galaxies are moderate: 10.1 < log($M_star/M_sun) < 10.4. Abundances within both high- and low-metallicity regions show flat radial gradients. The histogram for the spaxel abundances demonstrates two distinct peaks, the difference between the (O/H)_h and the (O/H)_l abundances are of 0.06 - 0.08 dex. The high-metallicity regions are located in the O/H - N/O diagram closer to the lower envelope of the band than the low-metallicity regions. The abundance properties in the massive galaxy can be explained by the low-metallicity gas infall onto the galaxy and subsequent starburst in the diluted interstellar gas. For moderate-mass galaxies, the higher oxygen abundance in the high-metallicity region and its shift towards the lower envelope in the N/O -- O/H diagram compared to the low-metallicity region can be explained in one of two ways: either the starburst in the high-metallicity region occurred several dozens of Myr ago, or the star formation in the galaxy is accompanied by galactic winds, and the region evolved with the lower efficiency of the enriched galactic winds shows higher metallicity. Two galaxies of our sample are members of galaxy pairs. However, the asymmetry parameter, A, quantifying the asymmetry of a light distribution across the galaxy, is above the canonical threshold (A = 0.35) between non-interacting/interacting galaxies in the massive galaxy only.
AI Key Findings
Get AI-generated insights about this paper's methodology, results, and significance.
Paper Details
PDF Preview
Citation Network
Current paper (gray), citations (green), references (blue)
Display is limited for performance on very large graphs.
Similar Papers
Found 4 papersNo citations found for this paper.
Comments (0)