Splines 'n Lines: Rest-frame galaxy spectral energy distributions via Bayesian functional data analysis
Publication
Metrics
AI Quick Summary
This paper introduces a Bayesian functional data analysis framework called *Splines 'n Lines* (SnL) to model and reconstruct the spectral energy distributions (SEDs) of galaxies, addressing issues like misaligned grids, missing data, and noise. The SnL model combines smooth continuum basis functions and line features to provide continuous, denoised, and accurate SED estimates, even where data is missing.
Paper Preview
Abstract
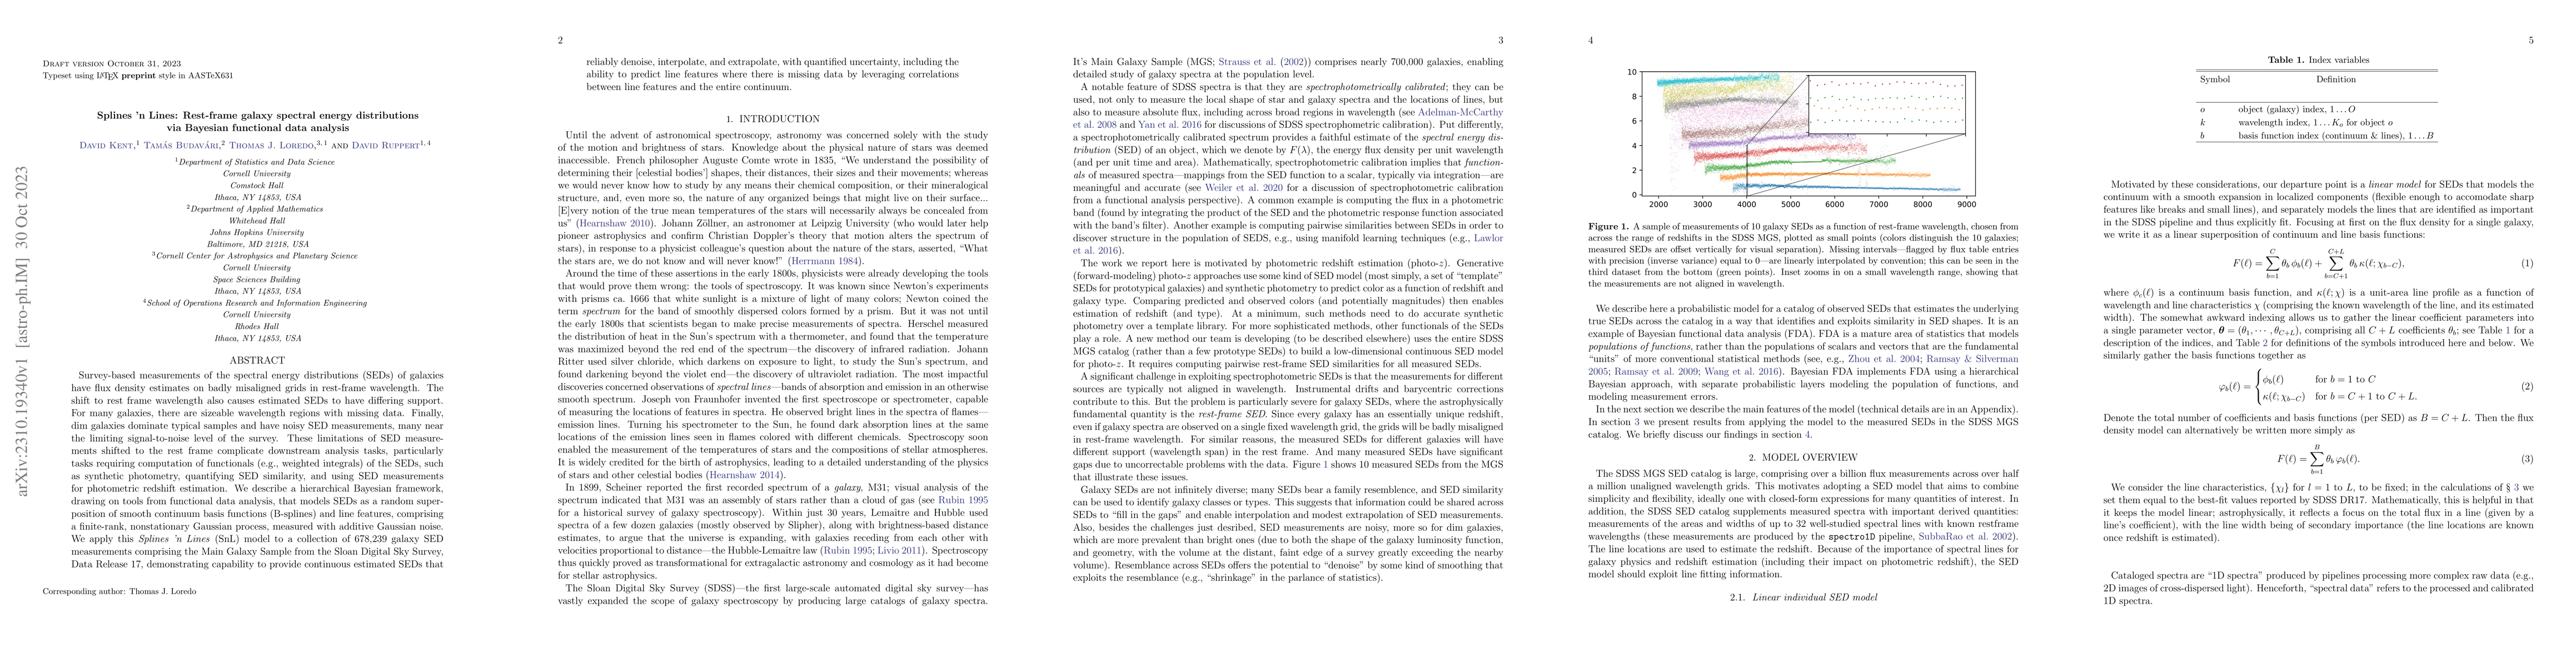
Survey-based measurements of the spectral energy distributions (SEDs) of galaxies have flux density estimates on badly misaligned grids in rest-frame wavelength. The shift to rest frame wavelength also causes estimated SEDs to have differing support. For many galaxies, there are sizeable wavelength regions with missing data. Finally, dim galaxies dominate typical samples and have noisy SED measurements, many near the limiting signal-to-noise level of the survey. These limitations of SED measurements shifted to the rest frame complicate downstream analysis tasks, particularly tasks requiring computation of functionals (e.g., weighted integrals) of the SEDs, such as synthetic photometry, quantifying SED similarity, and using SED measurements for photometric redshift estimation. We describe a hierarchical Bayesian framework, drawing on tools from functional data analysis, that models SEDs as a random superposition of smooth continuum basis functions (B-splines) and line features, comprising a finite-rank, nonstationary Gaussian process, measured with additive Gaussian noise. We apply this *Splines 'n Lines* (SnL) model to a collection of 678,239 galaxy SED measurements comprising the Main Galaxy Sample from the Sloan Digital Sky Survey, Data Release 17, demonstrating capability to provide continuous estimated SEDs that reliably denoise, interpolate, and extrapolate, with quantified uncertainty, including the ability to predict line features where there is missing data by leveraging correlations between line features and the entire continuum.
AI Key Findings
Get AI-generated insights about this paper's methodology, results, significance, and more — seven facets brought into focus.
Impact
Paper Details
Authors
PDF Preview
Key Terms
Citation Network
Current paper (gray), citations (green), references (blue)
Display is limited for performance on very large graphs.
Discussion 0