SQRQuerier: A Visual Querying Framework for Cross-national Survey Data Recycling
Publication
Metrics
AI Quick Summary
SDRQuerier is a visual querying framework designed to facilitate cross-national survey data analysis by addressing challenges in data harmonization and exploration. It uses a BERT-based model for customized queries, a visual interface to display data availability, and relational pattern analysis to improve regression models.
Paper Preview
Abstract
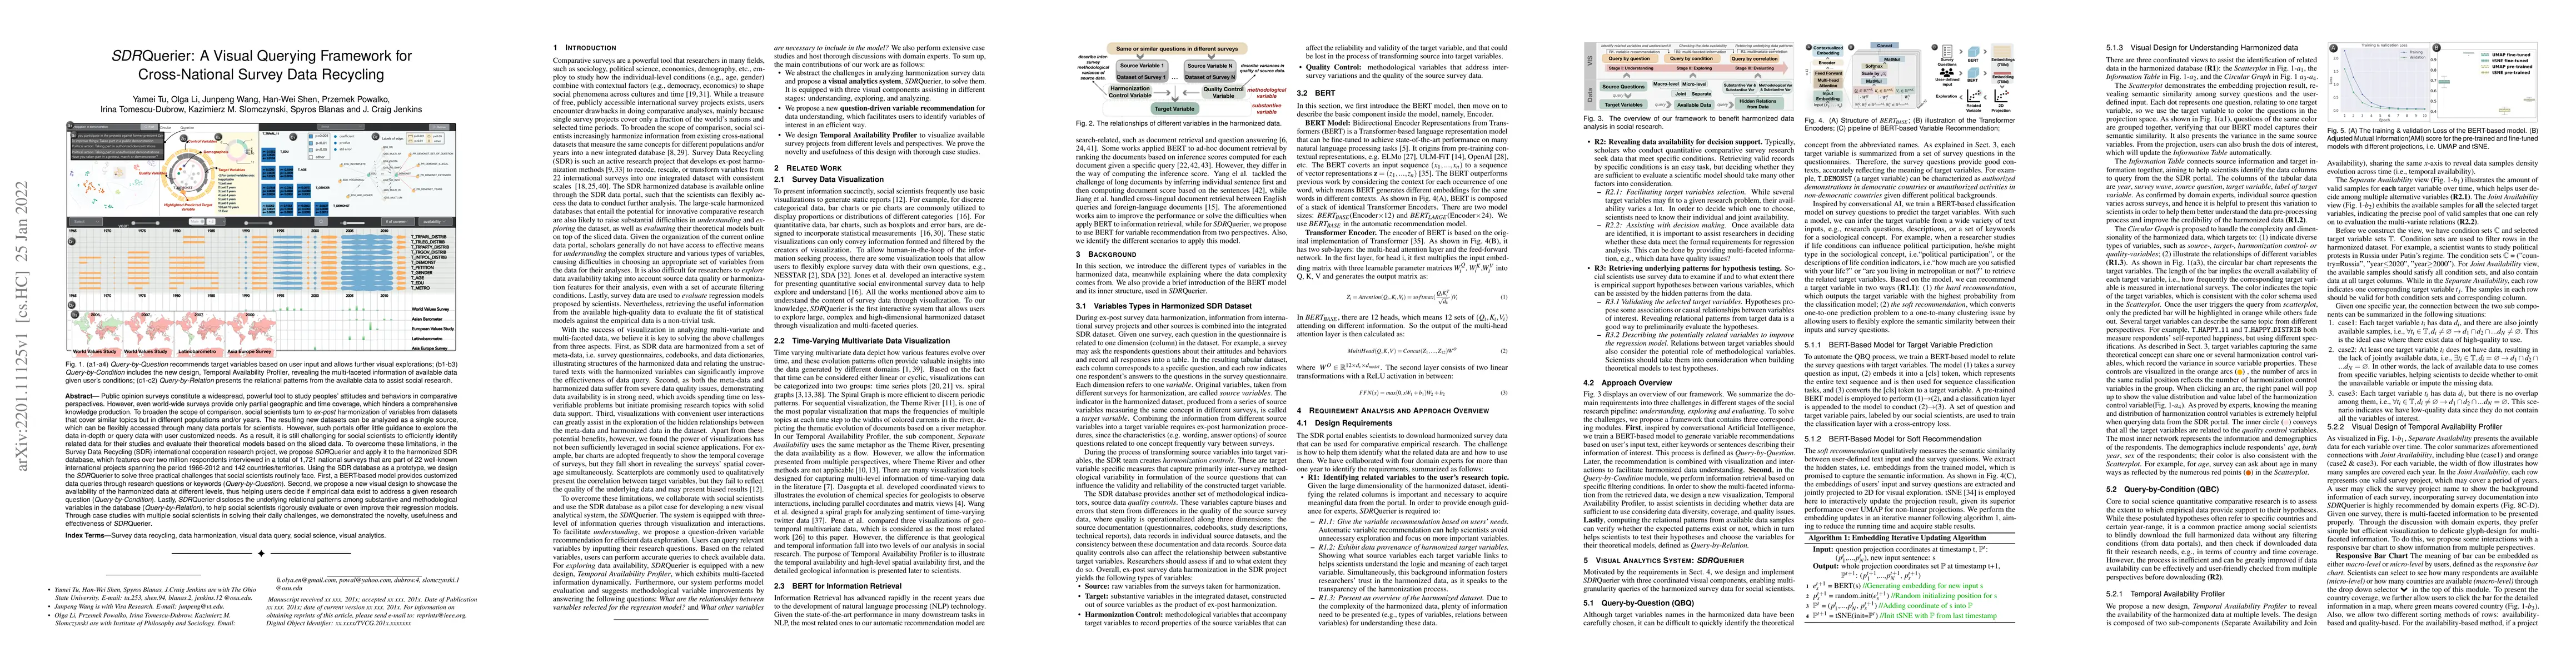
Public opinion surveys constitute a powerful tool to study peoples' attitudes and behaviors in comparative perspectives. However, even worldwide surveys provide only partial geographic and time coverage, which hinders comprehensive knowledge production. To broaden the scope of comparison, social scientists turn to ex-post harmonization of variables from datasets that cover similar topics but in different populations and/or years. The resulting new datasets can be analyzed as a single source, which can be flexibly accessed through many data portals. However, such portals offer little guidance to explore the data in-depth or query data with user-customized needs. As a result, it is still challenging for social scientists to efficiently identify related data for their studies and evaluate their theoretical models based on the sliced data. To overcome them, in the Survey Data Recycling (SDR) international cooperation research project, we propose SDRQuerier and apply it to the harmonized SDR database, which features over two million respondents interviewed in a total of 1,721 national surveys that are part of 22 well-known international projects. We design the SDRQuerier to solve three practical challenges that social scientists routinely face. First, a BERT-based model provides customized data queries through research questions or keywords. Second, we propose a new visual design to showcase the availability of the harmonized data at different levels, thus helping users decide if empirical data exist to address a given research question. Lastly, SDRQuerier discloses the underlying relational patterns among substantive and methodological variables in the database, to help social scientists rigorously evaluate or even improve their regression models. Through case studies with multiple social scientists in solving their daily challenges, we demonstrated the novelty, effectiveness of SDRQuerier.
AI Key Findings
Get AI-generated insights about this paper's methodology, results, significance, and more — seven facets brought into focus.
Impact
Paper Details
Authors
PDF Preview
Key Terms
Citation Network
Current paper (gray), citations (green), references (blue)
Display is limited for performance on very large graphs.
Discussion 0