This paper introduces Square Root Graphical Models (SQR), a new class of parametric graphical models that generalizes univariate exponential families to multivariate distributions, allowing for both positive and negative dependencies. The authors provide parameter estimation methods and demonstrate the model's effectiveness on synthetic and real-world airport delay datasets.
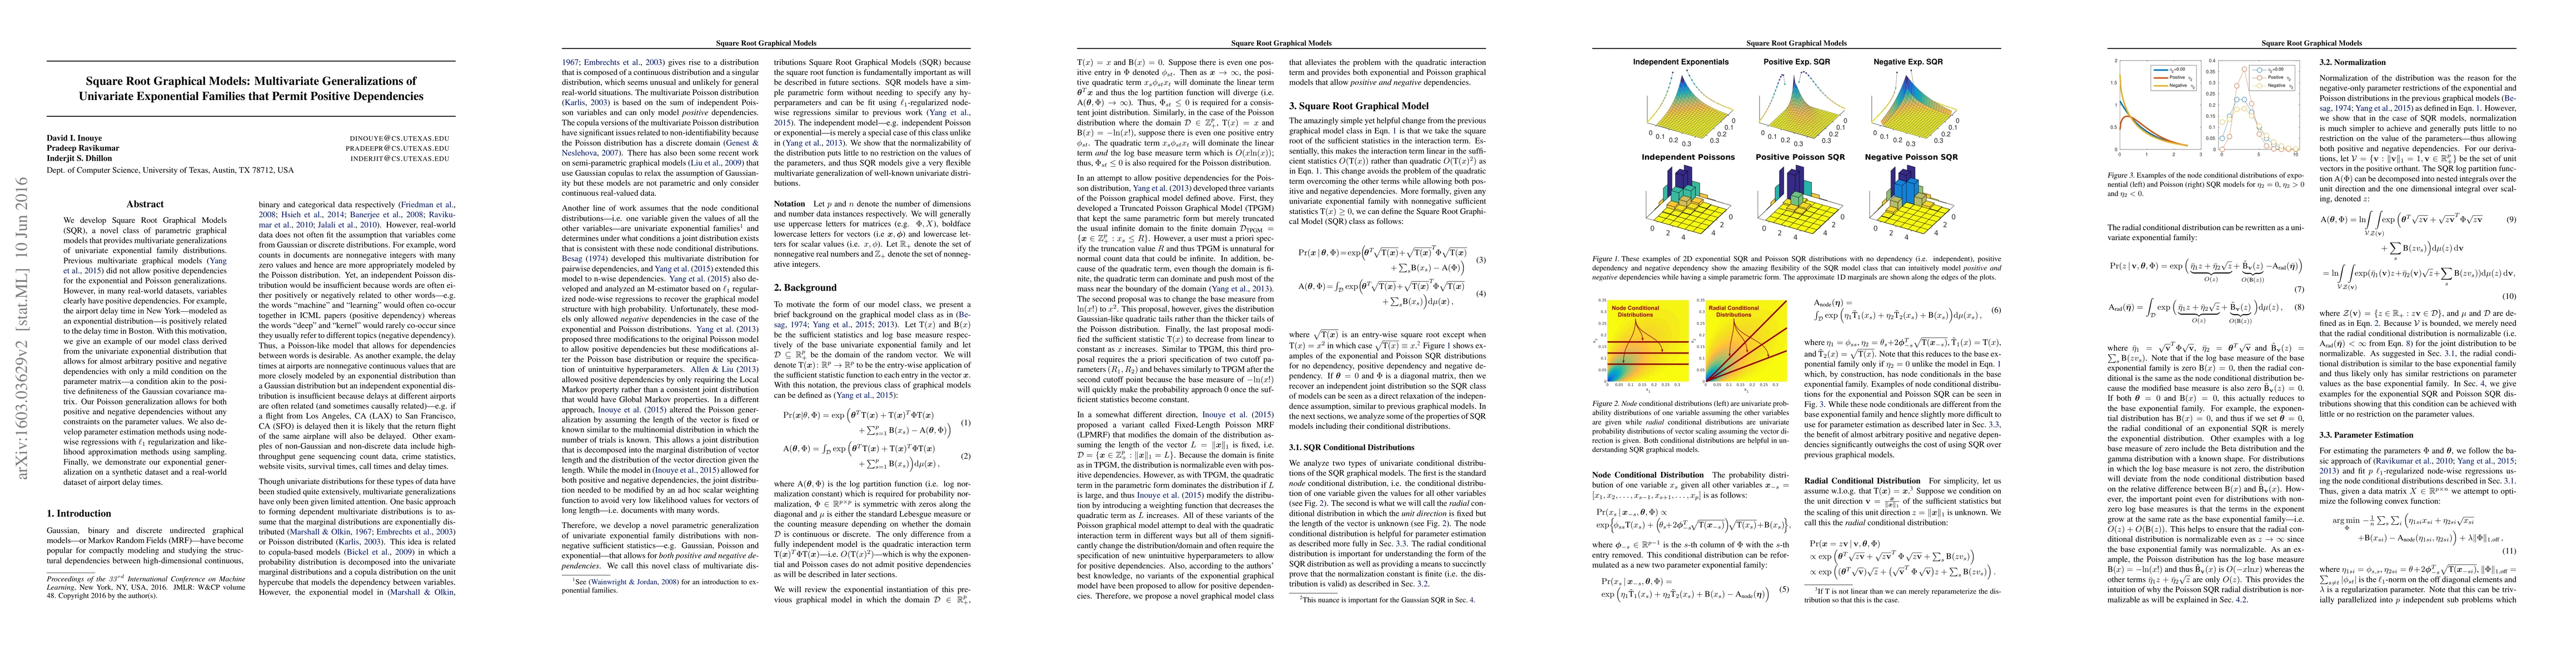
We develop Square Root Graphical Models (SQR), a novel class of parametric graphical models that provides multivariate generalizations of univariate exponential family distributions. Previous multivariate graphical models [Yang et al. 2015] did not allow positive dependencies for the exponential and Poisson generalizations. However, in many real-world datasets, variables clearly have positive dependencies. For example, the airport delay time in New York---modeled as an exponential distribution---is positively related to the delay time in Boston. With this motivation, we give an example of our model class derived from the univariate exponential distribution that allows for almost arbitrary positive and negative dependencies with only a mild condition on the parameter matrix---a condition akin to the positive definiteness of the Gaussian covariance matrix. Our Poisson generalization allows for both positive and negative dependencies without any constraints on the parameter values. We also develop parameter estimation methods using node-wise regressions with $\ell_1$ regularization and likelihood approximation methods using sampling. Finally, we demonstrate our exponential generalization on a synthetic dataset and a real-world dataset of airport delay times.
This graph shows how this paper is connected to other research. The current paper is shown in dark gray, papers that cite it are in green, and papers it references are in blue. You can:
• Hover over any node to see the paper title
• Click a node to view that paper's details
• Drag nodes to rearrange the graph
• Use the zoom controls (bottom right) to zoom in/out
Title | Authors | Year | Actions |
---|---|---|---|
Graphical models for multivariate extremes
|
Sebastian Engelke, Manuel Hentschel, Michael Lalancette, Frank Rottger
|
2024
|
View Paper |
On pairwise interaction multivariate Pareto models
|
Michael Lalancette
|
2023
|
View Paper |
Interaction Models and Generalized Score Matching for Compositional Data
|
Shiqing Yu, M. Drton, A. Shojaie
|
2021
|
View Paper |
Inference of large modified Poisson-type graphical models: Application to RNA-seq data in childhood atopic asthma studies
|
Rong Zhang, Zhao Ren, J. Celedón, Wei Chen
|
2021
|
View Paper |
Generalized score matching for general domains.
|
Shiqing Yu, M. Drton, A. Shojaie
|
2020
|
View Paper |
Accounting for missing actors in interaction network inference from abundance data
|
Raphaelle Momal, S. Robin, C. Ambroise
|
2020
|
View Paper |
Additive stacking for disaggregate electricity demand forecasting
|
Christian Capezza, B. Palumbo, Y. Goude, S. Wood, M. Fasiolo
|
2020
|
View Paper |
Simultaneous Inference for Pairwise Graphical Models with Generalized Score Matching
|
Ming Yu, Varun Gupta, M. Kolar
|
2019
|
View Paper |
Nonparametric graphical model for counts
|
Arkaprava Roy, D. Dunson
|
2019
|
View Paper |
Generalized Score Matching for Non-Negative Data
|
Shiqing Yu, M. Drton, A. Shojaie
|
2018
|
View Paper |
Temporal Poisson Square Root Graphical Models
|
Sinong Geng, Zhaobin Kuang, P. Peissig, David Page
|
2018
|
View Paper |
Learning gene regulatory networks from next generation sequencing data
|
B. Jia, Suwa Xu, Guanghua Xiao, V. Lamba, F. Liang
|
2017
|
View Paper |
Poisson Sum-Product Networks: A Deep Architecture for Tractable Multivariate Poisson Distributions
|
Alejandro Molina, Sriraam Natarajan, K. Kersting
|
2017
|
View Paper |
Graphical Models for Discrete and Continuous Data
|
Johannes Lederer
|
2016
|
View Paper |
A review of multivariate distributions for count data derived from the Poisson distribution
|
David I. Inouye, Eunho Yang, Genevera I. Allen, Pradeep Ravikumar
|
2016
|
View Paper |
Generalized Root Models: Beyond Pairwise Graphical Models for Univariate Exponential Families
|
David I. Inouye, Pradeep Ravikumar, I. Dhillon
|
2016
|
View Paper |
Statistical Guarantees for Consensus Clustering
|
Zhixin Zhou, Gautam Dudeja, A. Amini
|
2023
|
View Paper |
The Potts-Ising model for discrete multivariate data
|
Zahra S. Razaee, A. Amini
|
2020
|
View Paper |
Published: 2016-06-03
Comments (0)