ST-ABN: Visual Explanation Taking into Account Spatio-temporal Information for Video Recognition
Publication
Metrics
AI Quick Summary
This paper proposes the ST-ABN method for visual explanation in video recognition, integrating both spatial and temporal information to enhance interpretability and recognition performance. Experimental results show that ST-ABN effectively highlights discriminative regions in videos, improving both explainability and accuracy.
Paper Preview
Abstract
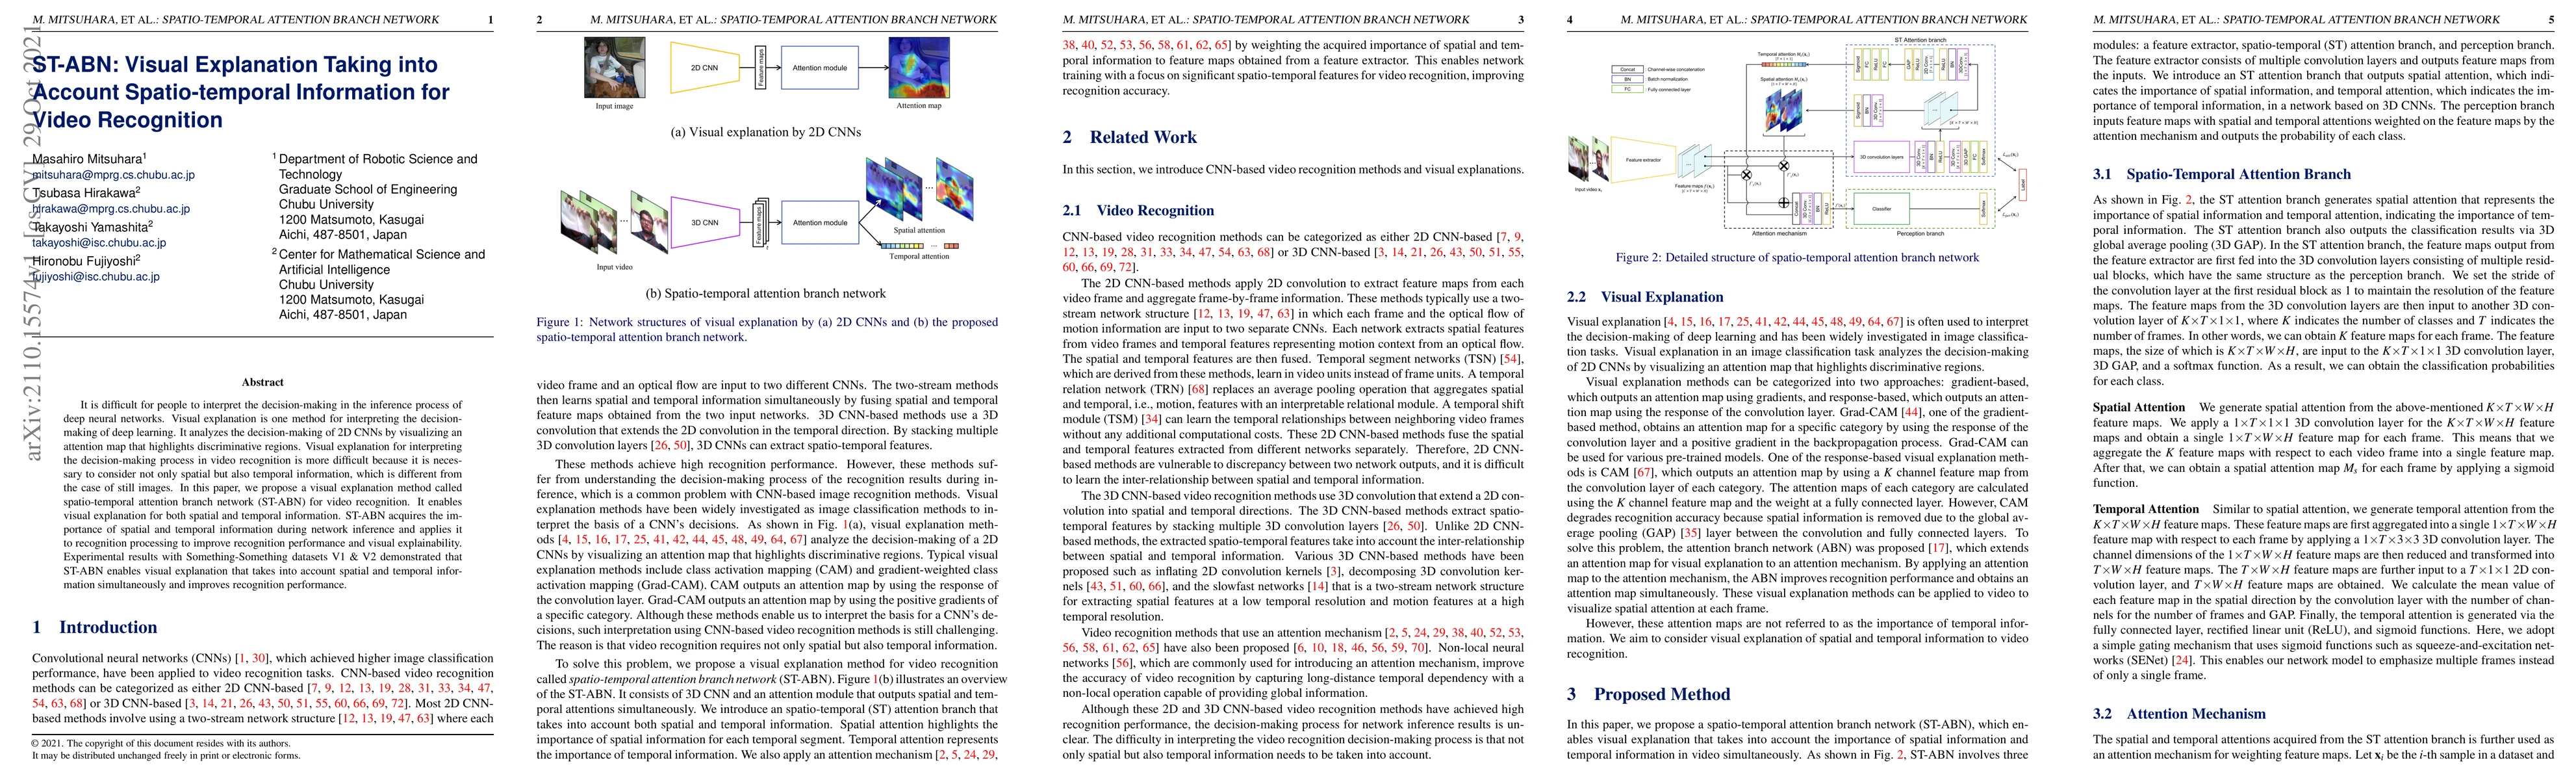
It is difficult for people to interpret the decision-making in the inference process of deep neural networks. Visual explanation is one method for interpreting the decision-making of deep learning. It analyzes the decision-making of 2D CNNs by visualizing an attention map that highlights discriminative regions. Visual explanation for interpreting the decision-making process in video recognition is more difficult because it is necessary to consider not only spatial but also temporal information, which is different from the case of still images. In this paper, we propose a visual explanation method called spatio-temporal attention branch network (ST-ABN) for video recognition. It enables visual explanation for both spatial and temporal information. ST-ABN acquires the importance of spatial and temporal information during network inference and applies it to recognition processing to improve recognition performance and visual explainability. Experimental results with Something-Something datasets V1 \& V2 demonstrated that ST-ABN enables visual explanation that takes into account spatial and temporal information simultaneously and improves recognition performance.
AI Key Findings
Get AI-generated insights about this paper's methodology, results, significance, and more — seven facets brought into focus.
Impact
Paper Details
Authors
PDF Preview
Key Terms
Citation Network
Current paper (gray), citations (green), references (blue)
Display is limited for performance on very large graphs.
Discussion 0