ST-Tree with Interpretability for Multivariate Time Series Classification
Publication
Metrics
AI Quick Summary
The paper proposes ST-Tree, a model that combines Swin Transformer for high accuracy in multivariate time series classification with a neural tree for interpretability. Experimental results on 10 UEA datasets show improved accuracy and clearer insights into the decision-making process.
Paper Preview
Abstract
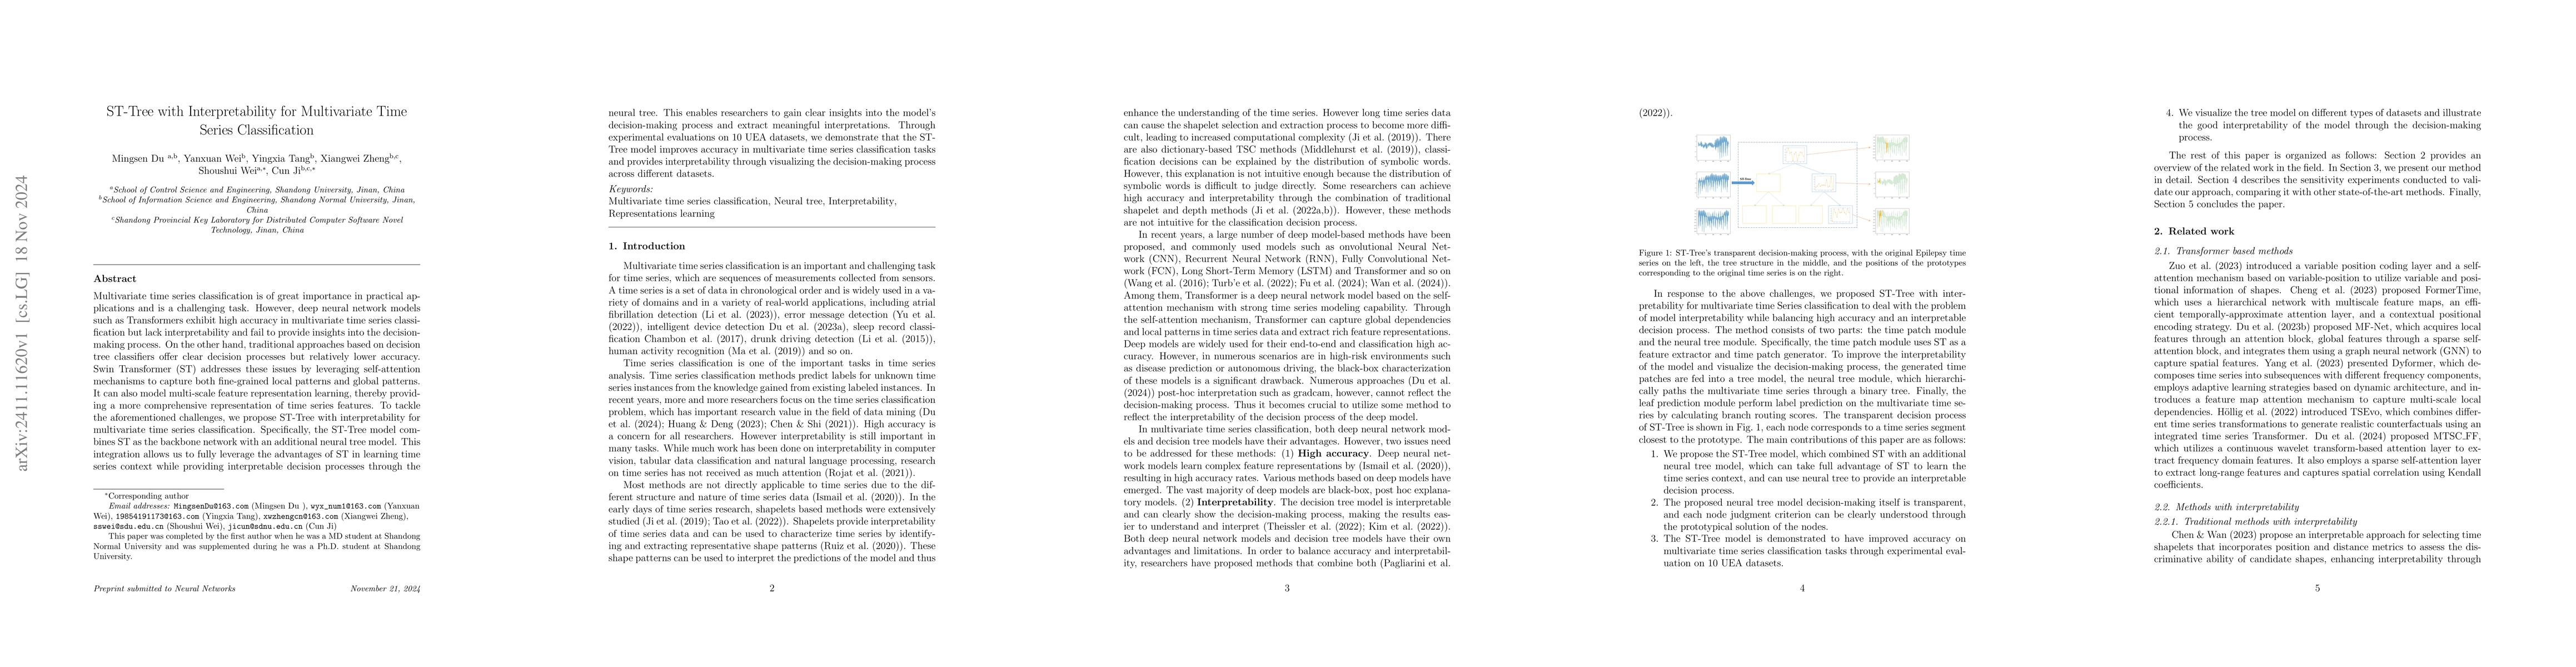
Multivariate time series classification is of great importance in practical applications and is a challenging task. However, deep neural network models such as Transformers exhibit high accuracy in multivariate time series classification but lack interpretability and fail to provide insights into the decision-making process. On the other hand, traditional approaches based on decision tree classifiers offer clear decision processes but relatively lower accuracy. Swin Transformer (ST) addresses these issues by leveraging self-attention mechanisms to capture both fine-grained local patterns and global patterns. It can also model multi-scale feature representation learning, thereby providing a more comprehensive representation of time series features. To tackle the aforementioned challenges, we propose ST-Tree with interpretability for multivariate time series classification. Specifically, the ST-Tree model combines ST as the backbone network with an additional neural tree model. This integration allows us to fully leverage the advantages of ST in learning time series context while providing interpretable decision processes through the neural tree. This enables researchers to gain clear insights into the model's decision-making process and extract meaningful interpretations. Through experimental evaluations on 10 UEA datasets, we demonstrate that the ST-Tree model improves accuracy in multivariate time series classification tasks and provides interpretability through visualizing the decision-making process across different datasets.
AI Key Findings
Get AI-generated insights about this paper's methodology, results, significance, and more — seven facets brought into focus.
Impact
Paper Details
Authors
PDF Preview
Citation Network
Current paper (gray), citations (green), references (blue)
Display is limited for performance on very large graphs.
Discussion 0