ArxivLens

Quick Summary:

This paper investigates the stability of linear Boolean networks using Derrida curves, revealing that linear networks exhibit a phase transition from order to chaos at an average in-degree of Kc=1, unlike general Boolean networks with Kc=2. The study also finds that unstable networks have many attractors with long cycles, while stable and critical networks have fewer and shorter cycles, and provides theoretical results on the proportion of attractor states, fixed points, and bijective linear Boolean networks.

DOI: 10.1016/j.physd.2023.133775
arXiv Id: 2209.02044
Comments: 18 pages, 3 figures
Date Published: 2023-06-14
Date Updated: 2023-06-14

Key Terms (TF-IDF):

boolean (0.315)
networks (0.211)
unstable (0.187)
linear systems (0.183)
stability (0.178)
operate (0.170)
cycles (0.162)
linear (0.158)
quantify (0.151)
network (0.150)
average (0.147)
critical (0.134)
curves (0.133)
formula (0.133)
regime (0.125)
degree (0.124)
exhibit (0.124)
number (0.122)
fixed (0.121)
stable (0.120)
License: http://creativecommons.org/licenses/by/4.0/

Summary:

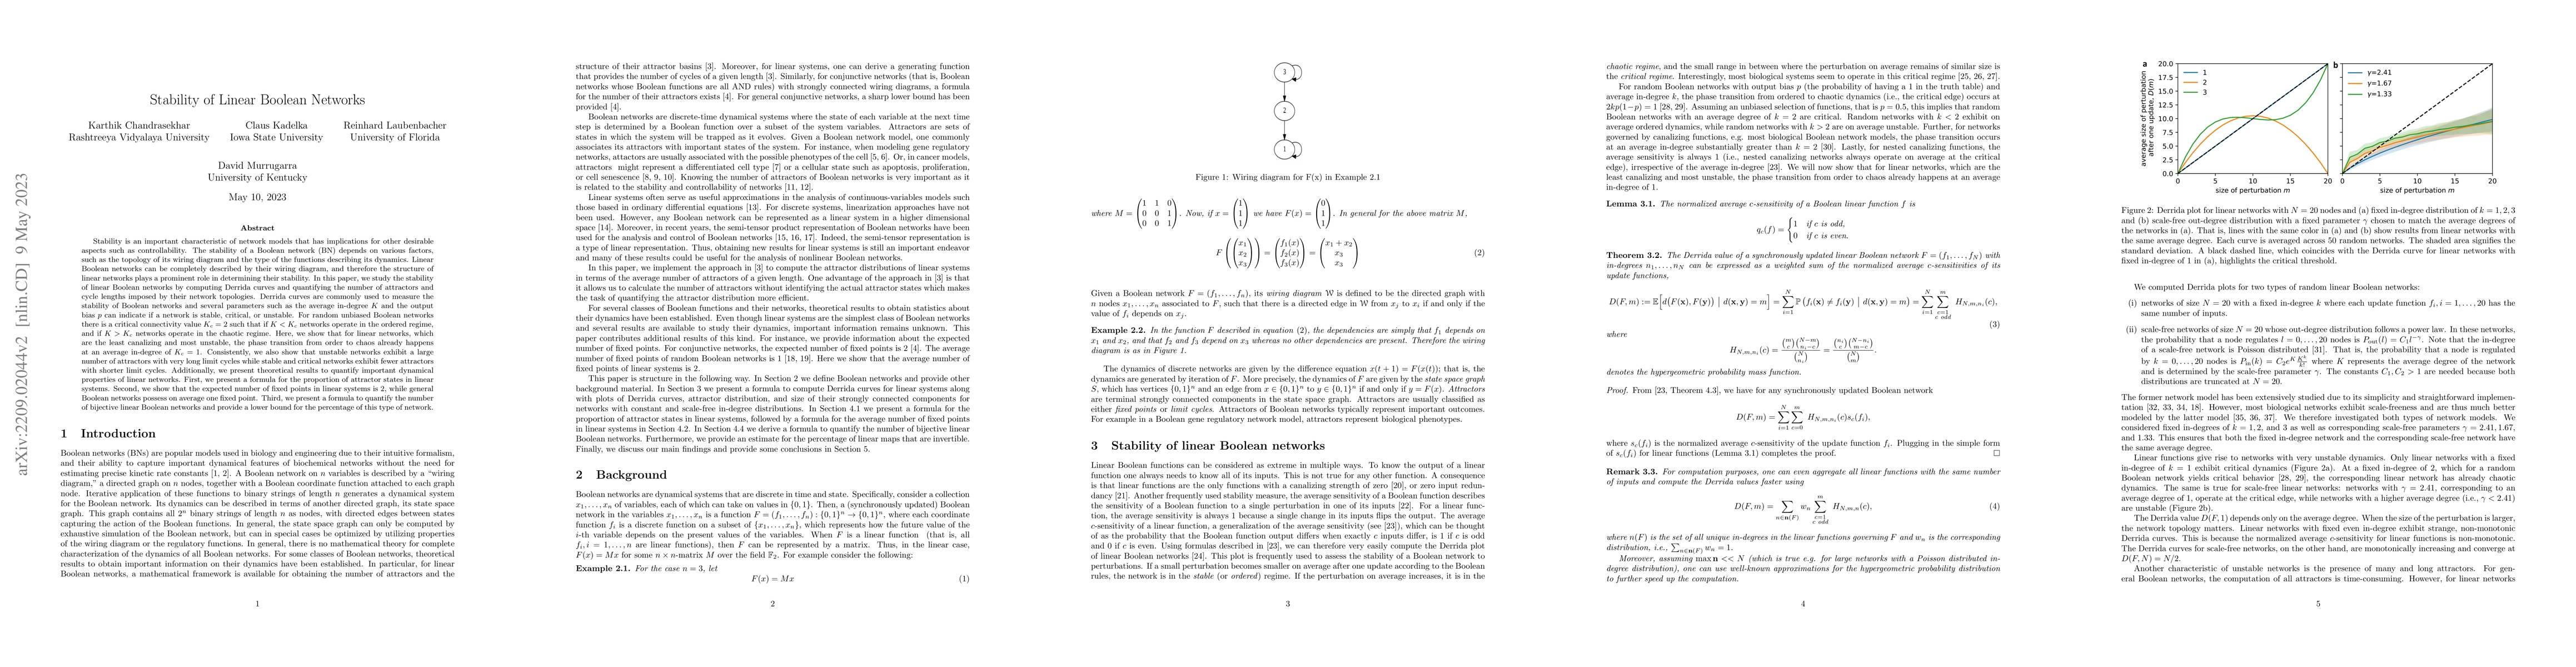
Stability is an important characteristic of network models that has implications for other desirable aspects such as controllability. The stability of a Boolean network depends on various factors, such as the topology of its wiring diagram and the type of the functions describing its dynamics. In this paper, we study the stability of linear Boolean networks by computing Derrida curves and quantifying the number of attractors and cycle lengths imposed by their network topologies. Derrida curves are commonly used to measure the stability of Boolean networks and several parameters such as the average in-degree K and the output bias p can indicate if a network is stable, critical, or unstable. For random unbiased Boolean networks there is a critical connectivity value Kc=2 such that if KKc networks operate in the chaotic regime. Here, we show that for linear networks, which are the least canalizing and most unstable, the phase transition from order to chaos already happens at an average in-degree of Kc=1. Consistently, we also show that unstable networks exhibit a large number of attractors with very long limit cycles while stable and critical networks exhibit fewer attractors with shorter limit cycles. Additionally, we present theoretical results to quantify important dynamical properties of linear networks. First, we present a formula for the proportion of attractor states in linear systems. Second, we show that the expected number of fixed points in linear systems is 2, while general Boolean networks possess on average one fixed point. Third, we present a formula to quantify the number of bijective linear Boolean networks and provide a lower bound for the percentage of this type of network.

Citation & Reference Network Visualization

This graph shows how this paper is connected to other research. The current paper is shown in dark gray, papers that cite it are in green, and papers it references are in blue. You can:

Current Paper
Papers citing this work (Citations)
Papers cited by this work (References)

• Hover over any node to see the paper title

• Click a node to view that paper's details

• Drag nodes to rearrange the graph

• Use the zoom controls (bottom right) to zoom in/out

Citations and References

Title Authors Year Actions
Canalization reduces the nonlinearity of regulation in biological networks
C. Kadelka, D. Murrugarra
2024
View Paper
The Complexity of Sequential Prediction in Dynamical Systems
Vinod Raman, Unique Subedi, Ambuj Tewari
2024
View Paper

Comments (0)

This website uses cookies to ensure you get the best experience. Learn more