Publication
Metrics
AI Quick Summary
This paper proposes Stacked Confusion Reject Plots (SCORE) to enhance the interpretability of reject curves in machine learning, offering a more intuitive visualization of classification certainty and performance. The authors provide an example with Gaussian data and release the code as a Python package.
Paper Preview
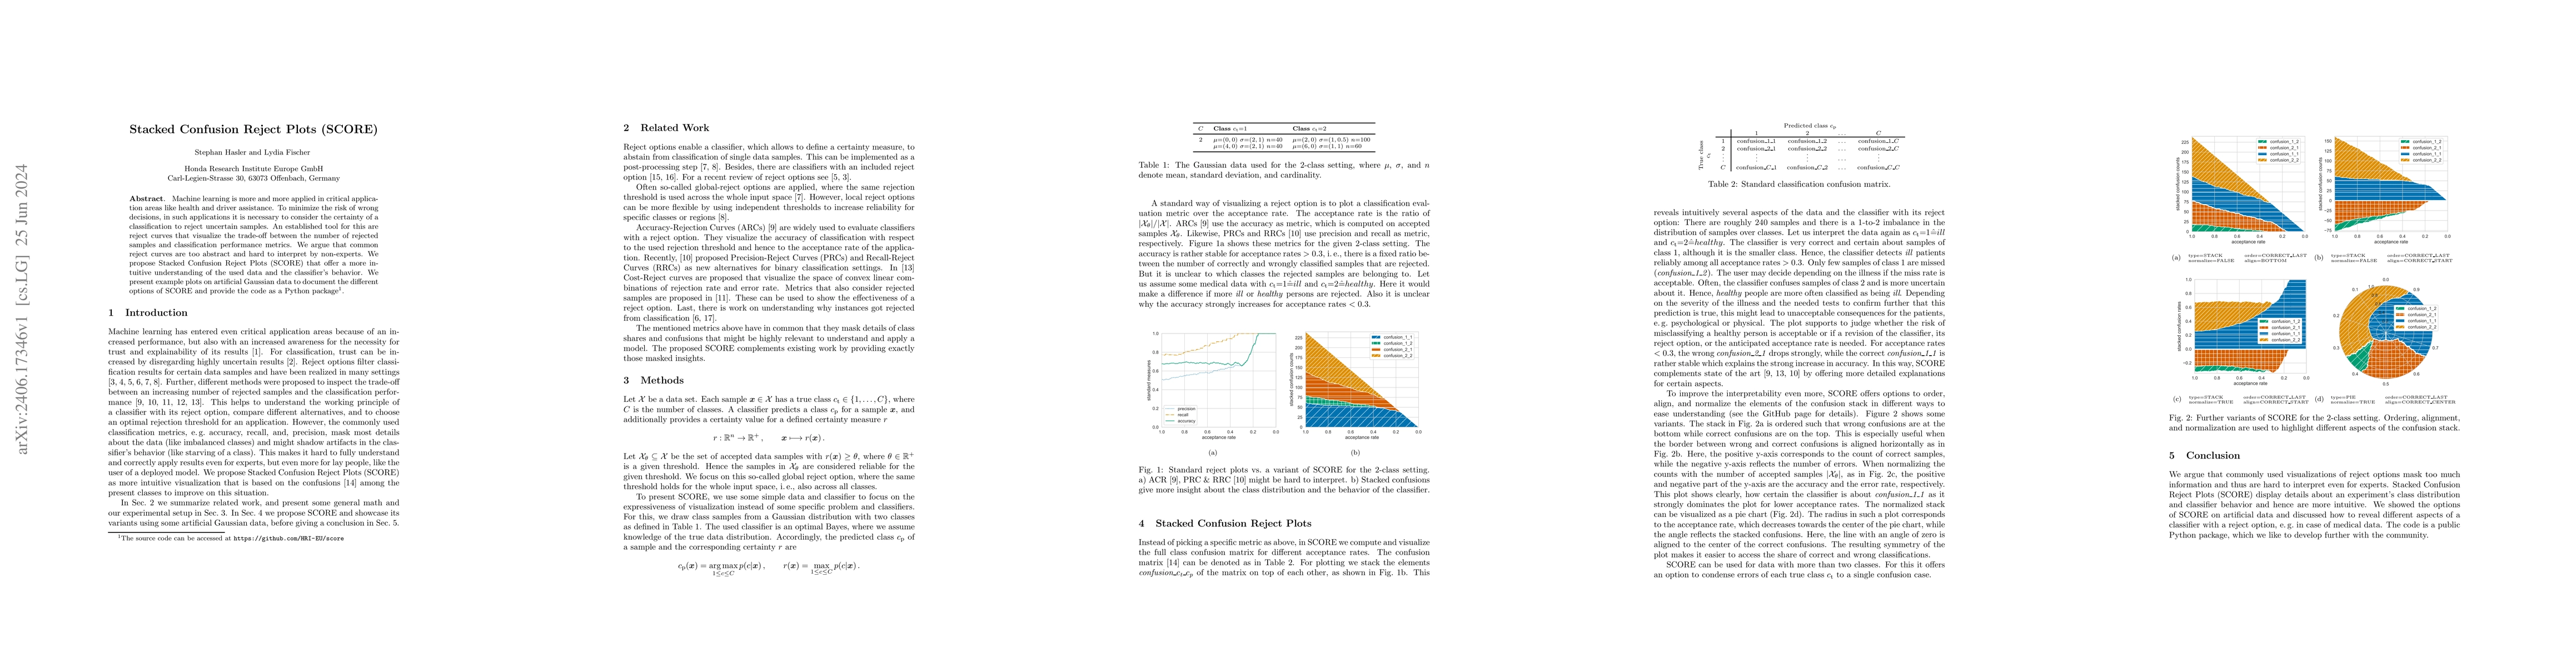
Abstract
Machine learning is more and more applied in critical application areas like health and driver assistance. To minimize the risk of wrong decisions, in such applications it is necessary to consider the certainty of a classification to reject uncertain samples. An established tool for this are reject curves that visualize the trade-off between the number of rejected samples and classification performance metrics. We argue that common reject curves are too abstract and hard to interpret by non-experts. We propose Stacked Confusion Reject Plots (SCORE) that offer a more intuitive understanding of the used data and the classifier's behavior. We present example plots on artificial Gaussian data to document the different options of SCORE and provide the code as a Python package.
AI Key Findings
Get AI-generated insights about this paper's methodology, results, significance, and more — seven facets brought into focus.
Impact
Authors
PDF Preview
Key Terms
Citation Network
Current paper (gray), citations (green), references (blue)
Display is limited for performance on very large graphs.
Discussion 0