Starlink Mini Satellite Brightness Distributions Across the Sky
Publication
Metrics
AI Quick Summary
This study determines the brightness distributions of Starlink Mini satellites during twilight and darkness, presenting sky maps and magnitude distributions. The research highlights that the brightest areas are during twilight, with notable flares also observed.
Paper Preview
Abstract
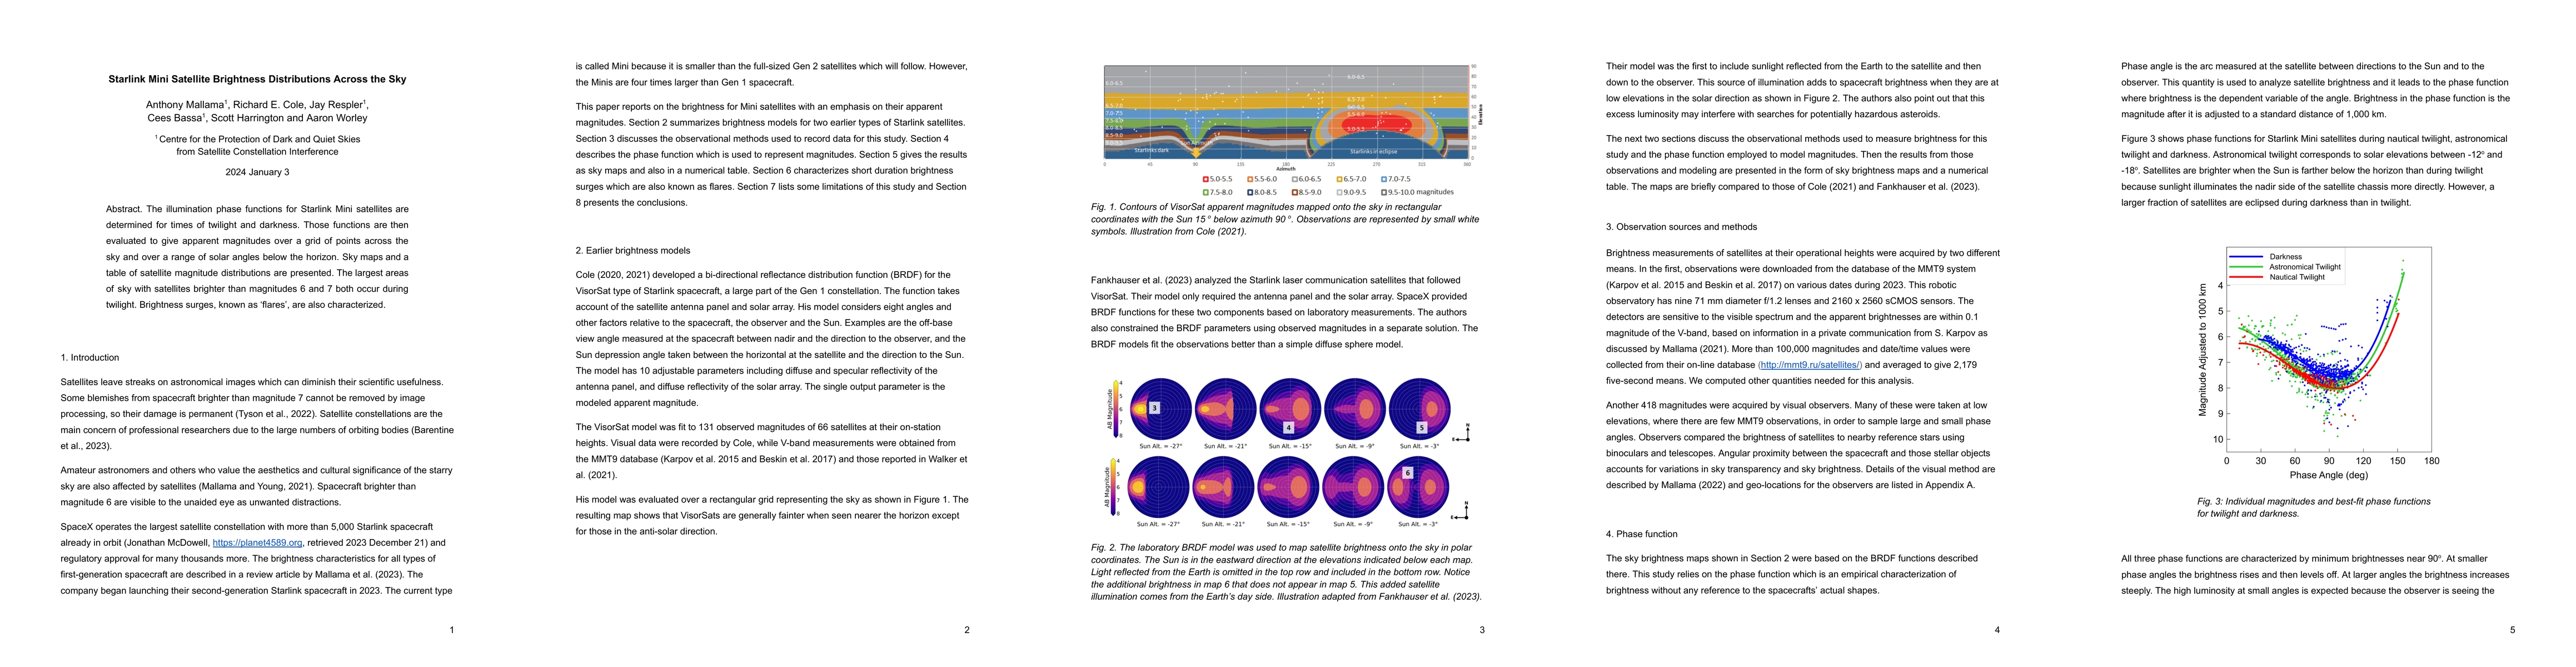
The illumination phase functions for Starlink Mini satellites are determined for times of twilight and darkness. Those functions are then evaluated to give apparent magnitudes over a grid of points across the sky and over a range of solar angles below the horizon. Sky maps and a table of satellite magnitude distributions are presented. The largest areas of sky with satellites brighter than magnitudes 6 and 7 both occur during twilight. Brightness surges, known as flares, are also characterized.
AI Key Findings
Get AI-generated insights about this paper's methodology, results, significance, and more — seven facets brought into focus.
Impact
Paper Details
Authors
PDF Preview
Key Terms
Citation Network
Current paper (gray), citations (green), references (blue)
Display is limited for performance on very large graphs.
Discussion 0