Publication
Metrics
AI Quick Summary
This study uses Hubble/WFC3 transit spectroscopy data to analyze exoplanetary atmospheres and find a positive correlation between water absorption and equilibrium temperature. However, the sample is also biased towards cooler planets, indicating that hotter planets have not yet been targeted for observation.
Paper Preview
Abstract
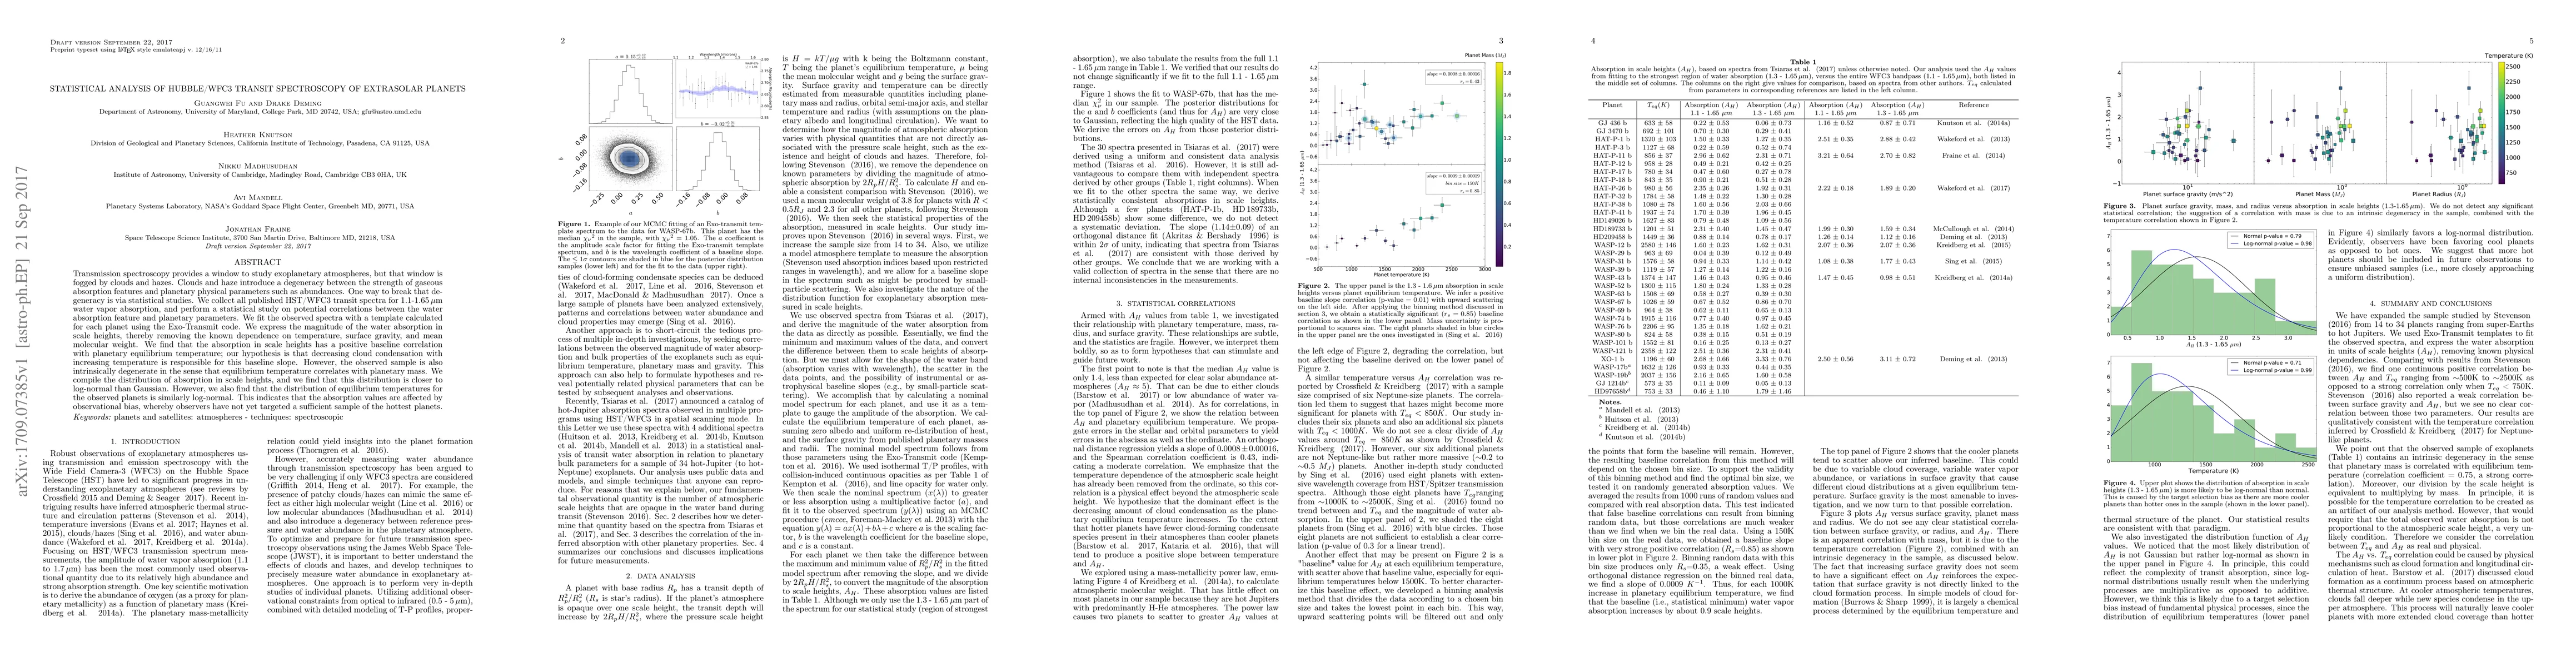
Transmission spectroscopy provides a window to study exoplanetary atmospheres, but that window is fogged by clouds and hazes. Clouds and haze introduce a degeneracy between the strength of gaseous absorption features and planetary physical parameters such as abundances. One way to break that degeneracy is via statistical studies. We collect all published HST/WFC3 transit spectra for 1.1-1.65 $\mu$m water vapor absorption, and perform a statistical study on potential correlations between the water absorption feature and planetary parameters. We fit the observed spectra with a template calculated for each planet using the Exo-Transmit code. We express the magnitude of the water absorption in scale heights, thereby removing the known dependence on temperature, surface gravity, and mean molecular weight. We find that the absorption in scale heights has a positive baseline correlation with planetary equilibrium temperature; our hypothesis is that decreasing cloud condensation with increasing temperature is responsible for this baseline slope. However, the observed sample is also intrinsically degenerate in the sense that equilibrium temperature correlates with planetary mass. We compile the distribution of absorption in scale heights, and we find that this distribution is closer to log-normal than Gaussian. However, we also find that the distribution of equilibrium temperatures for the observed planets is similarly log-normal. This indicates that the absorption values are affected by observational bias, whereby observers have not yet targeted a sufficient sample of the hottest planets.
AI Key Findings
Get AI-generated insights about this paper's methodology, results, significance, and more — seven facets brought into focus.
Impact
Paper Details
PDF Preview
Key Terms
Citation Network
Current paper (gray), citations (green), references (blue)
Display is limited for performance on very large graphs.
Discussion 0