Statistical Modeling for Spatio-Temporal Degradation Data
Publication
Metrics
AI Quick Summary
This paper develops a statistical model for spatio-temporal degradation data, addressing spatial heterogeneity and anisotropic covariance structures. It demonstrates the model's connection to existing time-dependent degradation processes and validates it through a numerical example.
Paper Preview
Abstract
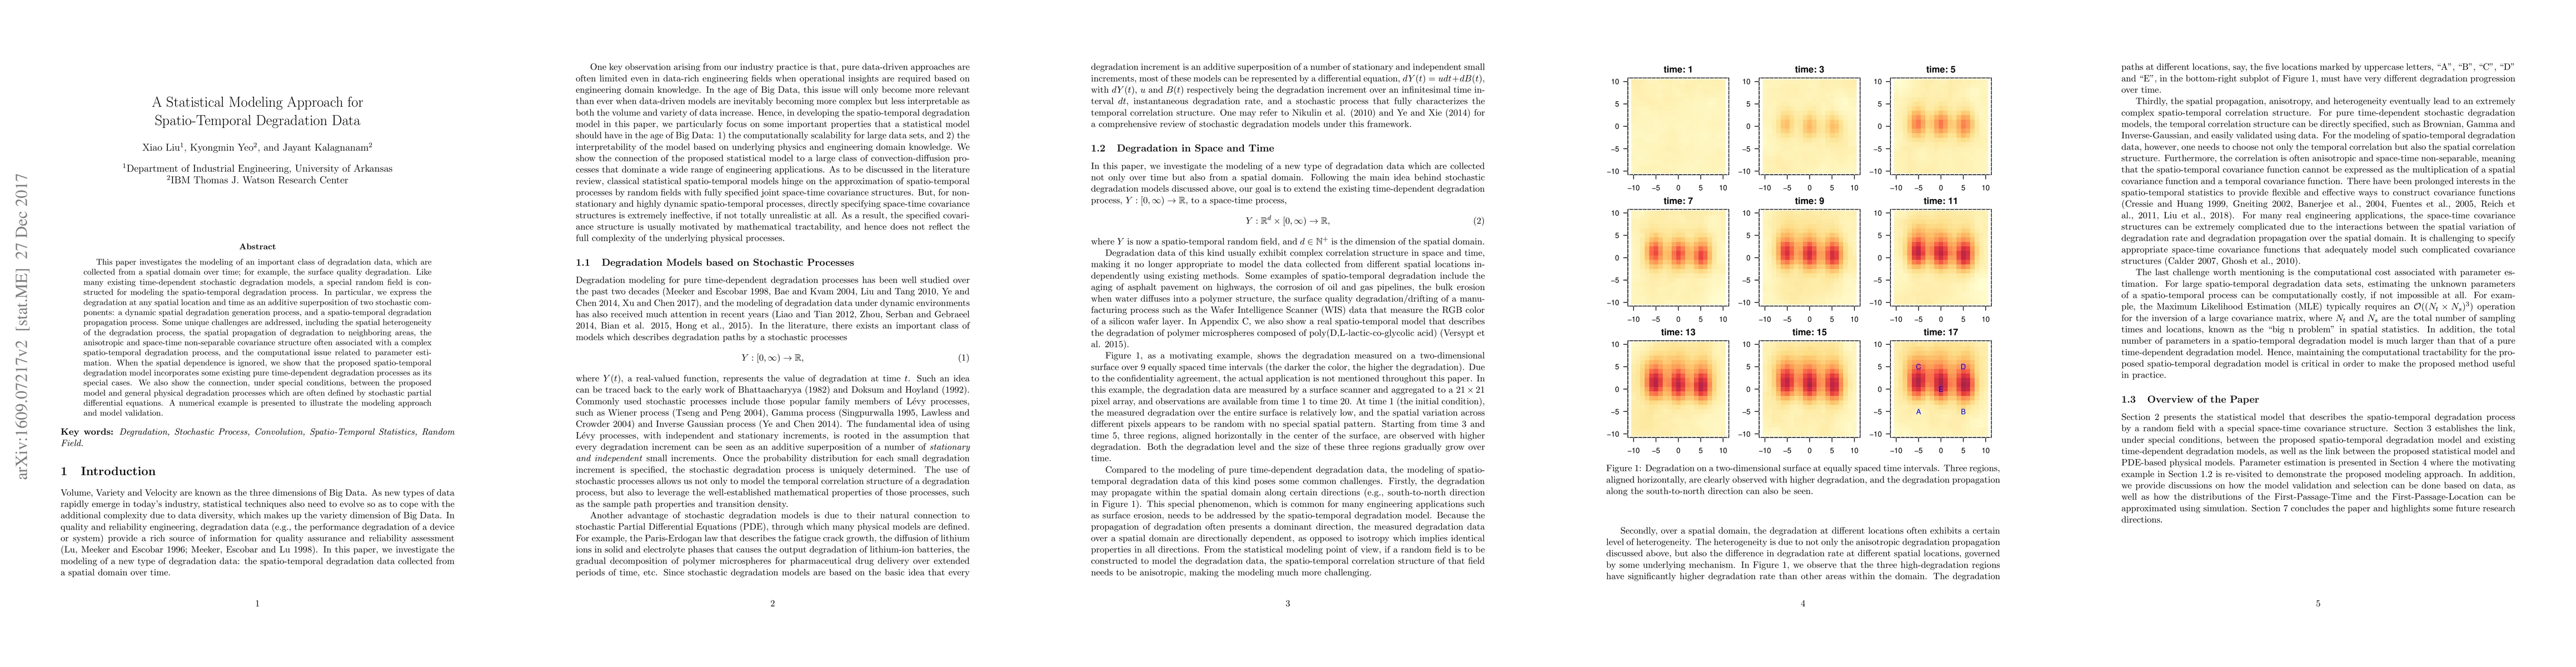
This paper investigates the modeling of an important class of degradation data, which are collected from a spatial domain over time; for example, the surface quality degradation. Like many existing time-dependent stochastic degradation models, a special random field is constructed for modeling the spatio-temporal degradation process. In particular, we express the degradation at any spatial location and time as an additive superposition of two stochastic components: a dynamic spatial degradation generation process, and a spatio-temporal degradation propagation process. Some unique challenges are addressed, including the spatial heterogeneity of the degradation process, the spatial propagation of degradation to neighboring areas, the anisotropic and space-time non-separable covariance structure often associated with a complex spatio-temporal degradation process, and the computational issue related to parameter estimation. When the spatial dependence is ignored, we show that the proposed spatio-temporal degradation model incorporates some existing pure time-dependent degradation processes as its special cases. We also show the connection, under special conditions, between the proposed model and general physical degradation processes which are often defined by stochastic partial differential equations. A numerical example is presented to illustrate the modeling approach and model validation.
AI Key Findings
Get AI-generated insights about this paper's methodology, results, significance, and more — seven facets brought into focus.
Impact
Paper Details
PDF Preview
Key Terms
Citation Network
Current paper (gray), citations (green), references (blue)
Display is limited for performance on very large graphs.
Discussion 0