Statistical Rendering for Visualization of Red Sea Eddy Simulation Data
Publication
Metrics
AI Quick Summary
This paper applies statistical visualization techniques to analyze Red Sea eddy simulation data, focusing on energy and particle transport insights. It employs statistical volume rendering and Morse complex summary maps to study eddy positions and their uncertainties, highlighting the methods' effectiveness in visualizing potential eddy locations and associated spatial uncertainties.
Paper Preview
Abstract
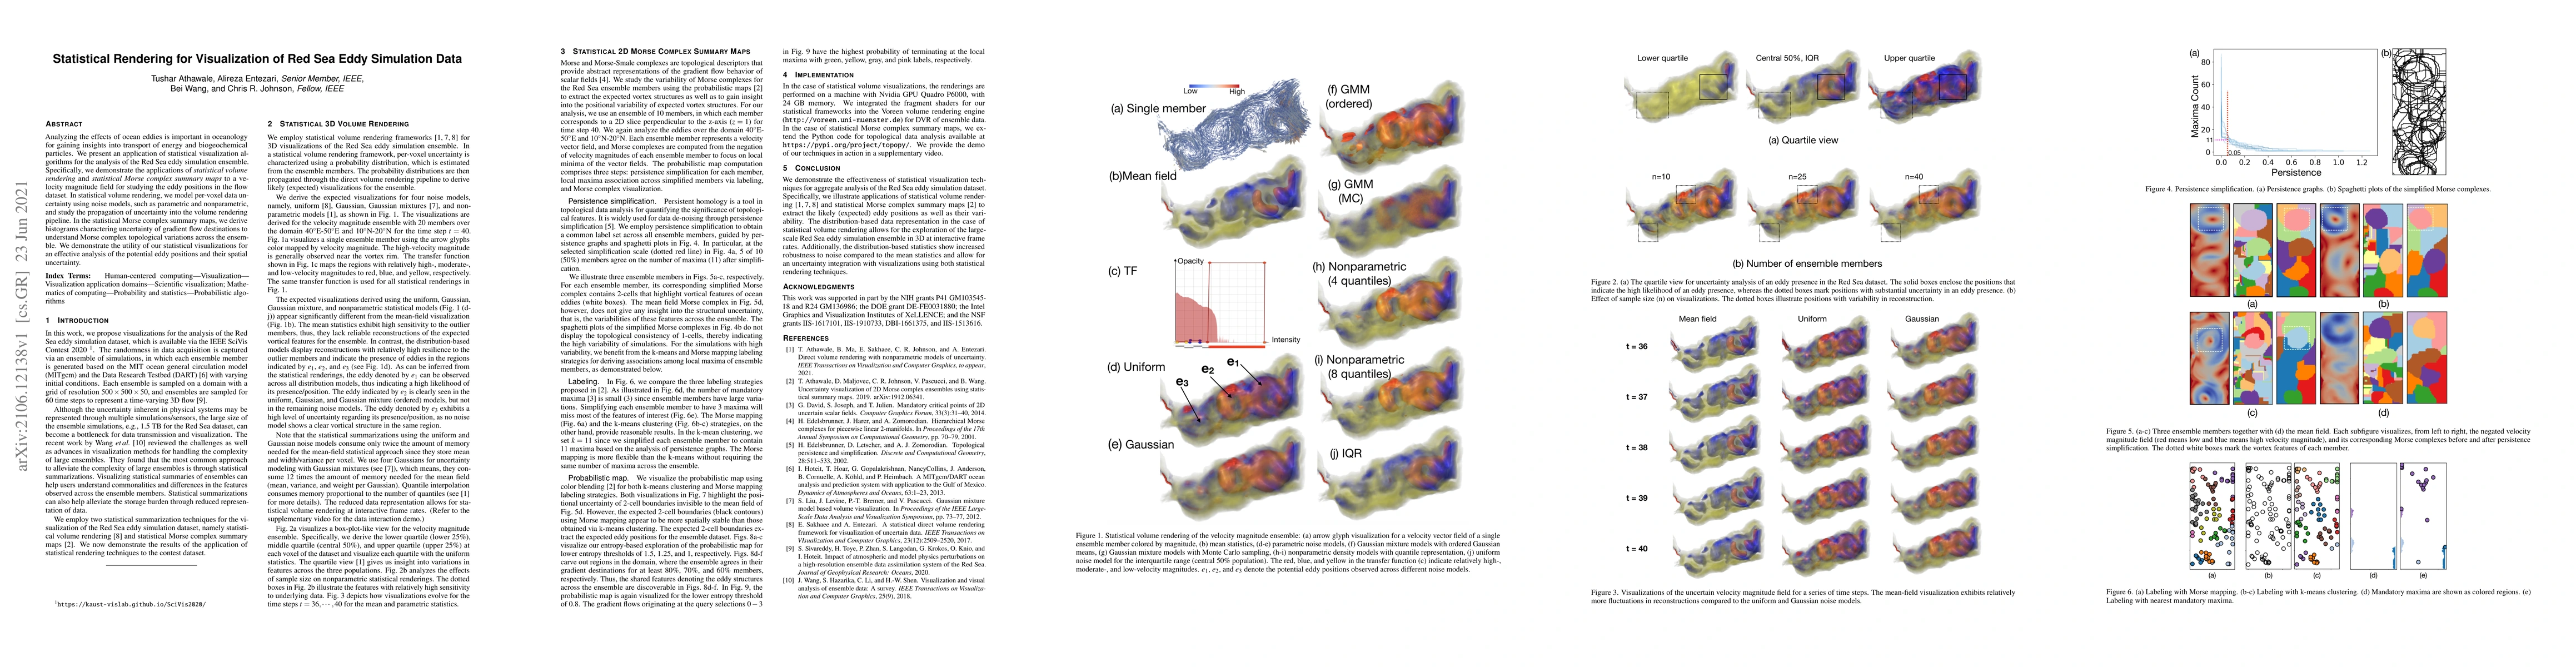
Analyzing the effects of ocean eddies is important in oceanology for gaining insights into transport of energy and biogeochemical particles. We present an application of statistical visualization algorithms for the analysis of the Red Sea eddy simulation ensemble. Specifically, we demonstrate the applications of statistical volume rendering and statistical Morse complex summary maps to a velocity magnitude field for studying the eddy positions in the flow dataset. In statistical volume rendering, we model per-voxel data uncertainty using noise models, such as parametric and nonparametric, and study the propagation of uncertainty into the volume rendering pipeline. In the statistical Morse complex summary maps, we derive histograms charactering uncertainty of gradient flow destinations to understand Morse complex topological variations across the ensemble. We demonstrate the utility of our statistical visualizations for an effective analysis of the potential eddy positions and their spatial uncertainty.
AI Key Findings
Get AI-generated insights about this paper's methodology, results, significance, and more — seven facets brought into focus.
Impact
Paper Details
Authors
PDF Preview
Key Terms
Citation Network
Current paper (gray), citations (green), references (blue)
Display is limited for performance on very large graphs.
Discussion 0