Publication
Metrics
AI Quick Summary
This study analyzes plasmoids in the post-CME current sheet using EUV and white-light coronagraph images, identifying their evolution and movement patterns. The research finds that plasmoids exhibit different widths and speeds depending on their direction of motion and observational scale, becoming super-Alfvénic at larger distances, and suggests a power law distribution for their widths.
Paper Preview
Abstract
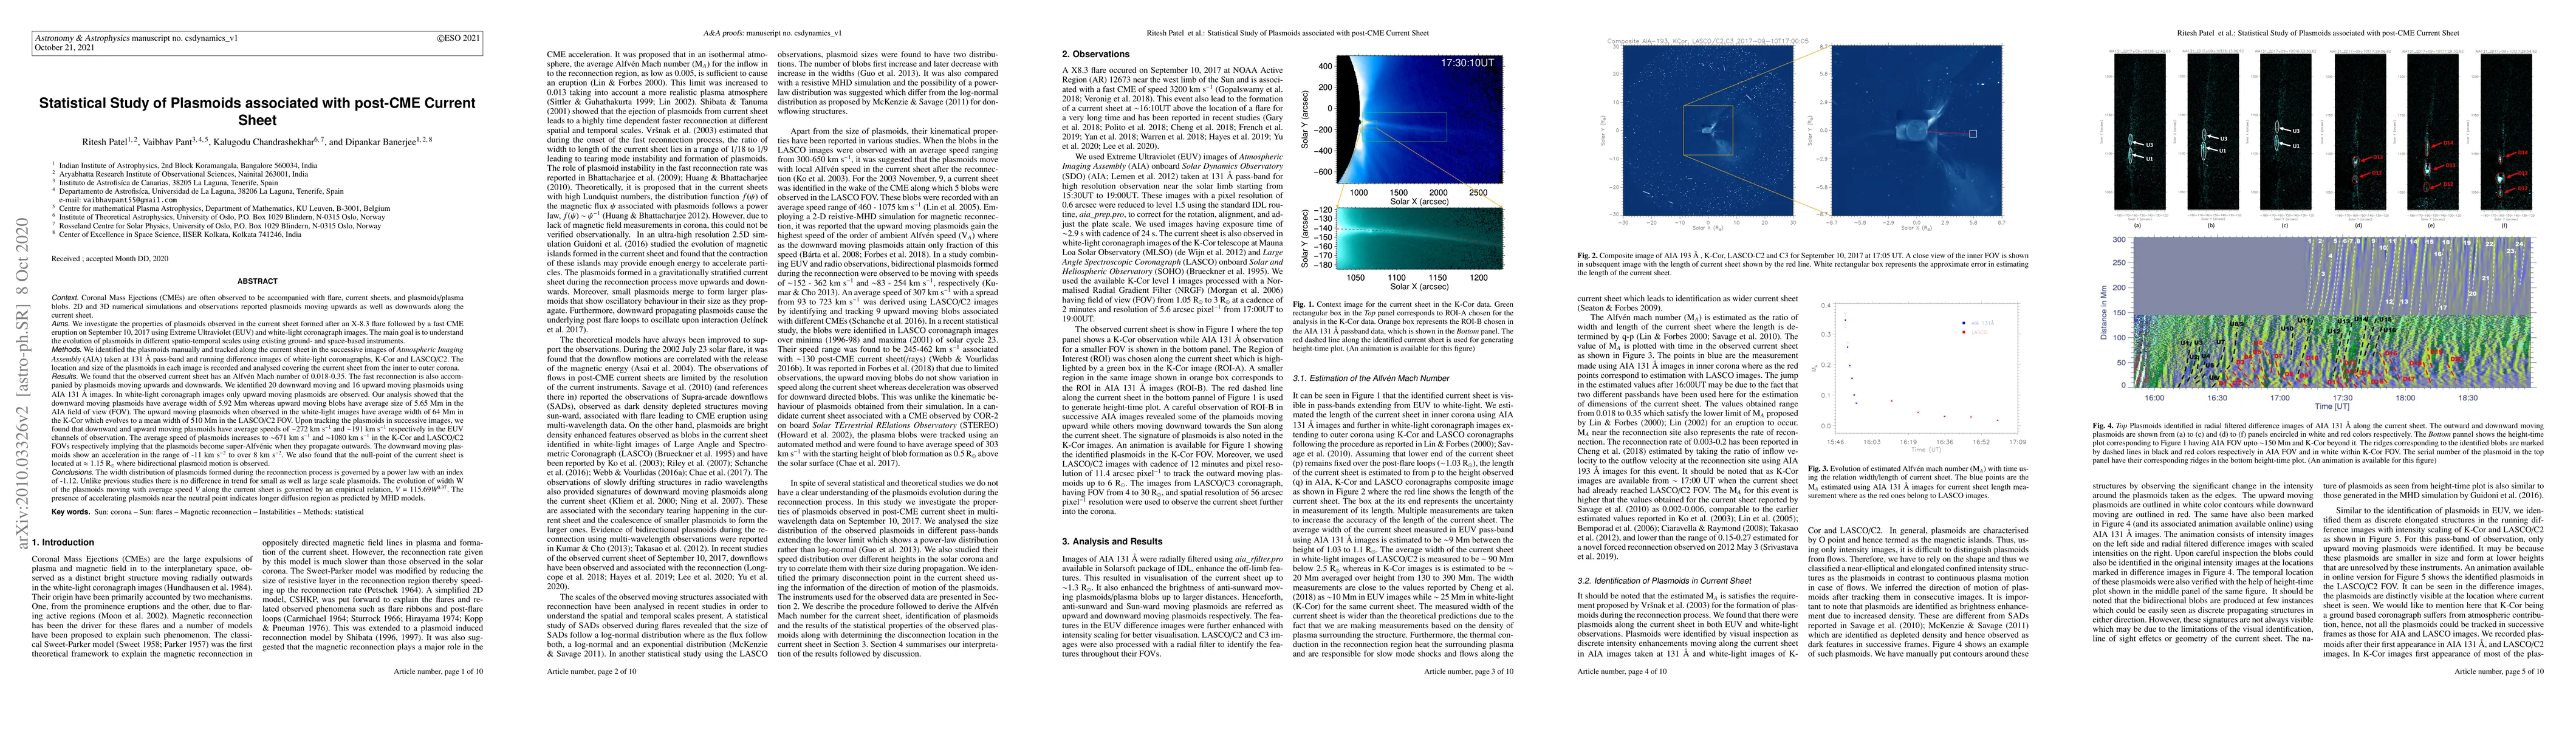
We investigate the properties of plasmoids observed in the current sheet formed after an X-8.3 flare followed by a fast CME eruption on September 10, 2017 using Extreme Ultraviolet (EUV) and white-light coronagraph images. The main aim is to understand the evolution of plasmoids at different spatio-temporal scales using existing ground- and space-based instruments. We identified the plasmoids in current sheet observed in the successive images of {\it Atmospheric Imaging Assembly} (AIA) and white-light coronagraphs, K-Cor and LASCO/C2. We found that the current sheet is accompanied by several plasmoids moving upwards and downwards. Our analysis showed that the downward and upward moving plasmoids have average width of 5.92 Mm and 5.65 Mm, respectively in the AIA field of view (FOV). However, upward moving plasmoids have average width of 64 Mm in the K-Cor which evolves to a mean width of 510 Mm in the LASCO/C2 FOV. Upon tracking the plasmoids in successive images, we observe that downward and upward moving plasmoids have average speeds of $\sim$272 km s$^{-1}$ and $\sim$191 km s$^{-1}$ respectively in the EUV passbands. We note that the plasmoids become super-Alfv\'enic when they reach at LASCO FOV. Furthermore, we estimate that the null-point of the current sheet at $\approx$ 1.15 R$_\odot$ where bidirectional plasmoid motion is observed. We study the width distribution of plasmoids formed and notice that it is governed by a power law with a power index of -1.12. Unlike previous studies there is no difference in trend for small and large scale plasmoids. The presence of accelerating plasmoids near the neutral point indicates a longer diffusion region as predicted by MHD models.
AI Key Findings
Get AI-generated insights about this paper's methodology, results, significance, and more — seven facets brought into focus.
Impact
Paper Details
Authors
PDF Preview
Key Terms
Citation Network
Current paper (gray), citations (green), references (blue)
Display is limited for performance on very large graphs.
Discussion 0