Summary
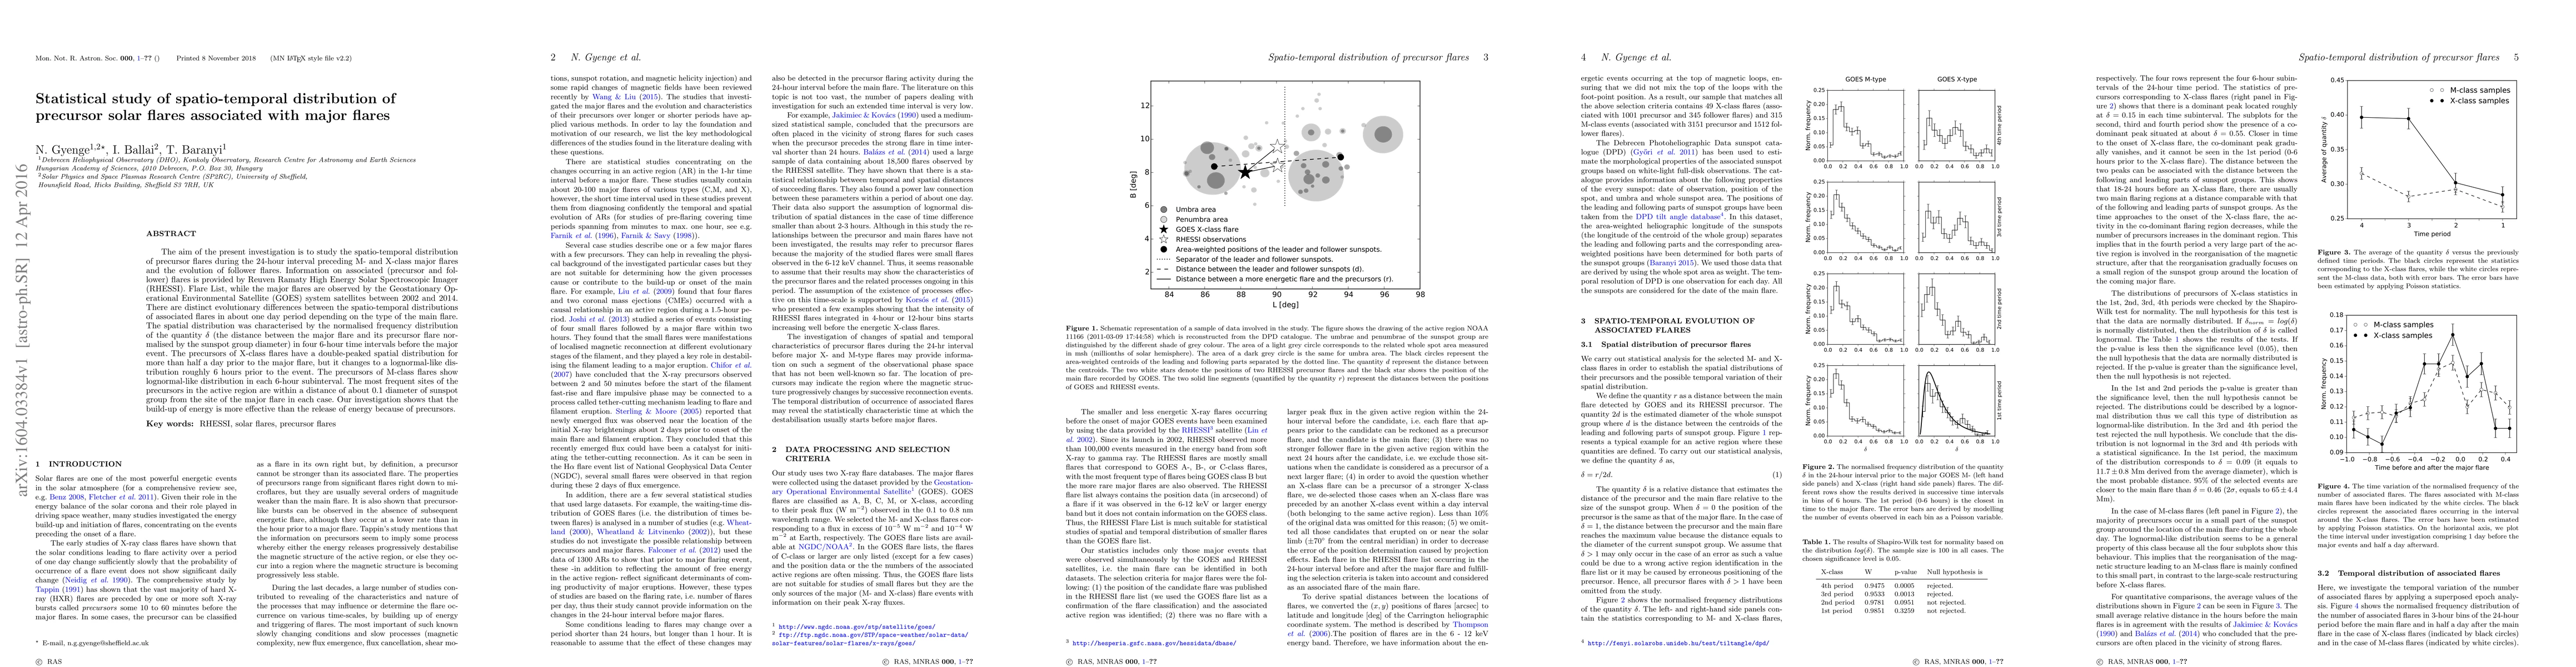
The aim of the present investigation is to study the spatio-temporal distribution of precursor flares during the 24-hour interval preceding M- and X-class major flares and the evolution of follower flares. Information on associated (precursor and follower) flares is provided by Reuven Ramaty High Energy Solar Spectroscopic Imager (RHESSI). Flare List, while the major flares are observed by the Geostationary Operational Environmental Satellite (GOES) system satellites between 2002 and 2014. There are distinct evolutionary differences between the spatio-temporal distributions of associated flares in about one day period depending on the type of the main flare. The spatial distribution was characterised by the normalised frequency distribution of the quantity $\delta$ (the distance between the major flare and its precursor flare normalised by the sunspot group diameter) in four 6-hour time intervals before the major event. The precursors of X-class flares have a double-peaked spatial distribution for more than half a day prior to the major flare, but it changes to a lognormal-like distribution roughly 6 hours prior to the event. The precursors of M-class flares show lognormal-like distribution in each 6-hour subinterval. The most frequent sites of the precursors in the active region are within a distance of about 0.1 diameter of sunspot group from the site of the major flare in each case. Our investigation shows that the build-up of energy is more effective than the release of energy because of precursors.
AI Key Findings
Get AI-generated insights about this paper's methodology, results, and significance.
Paper Details
PDF Preview
Key Terms
Citation Network
Current paper (gray), citations (green), references (blue)
Display is limited for performance on very large graphs.
Similar Papers
Found 4 papers| Title | Authors | Year | Actions |
|---|
Comments (0)