Stochastic modeling of a serial killer
Publication
Metrics
AI Quick Summary
A serial killer's murder pattern follows a power law distribution of intervals between crimes, suggesting that neural activity in their brain exceeds a certain threshold before committing a murder.
Paper Preview
Abstract
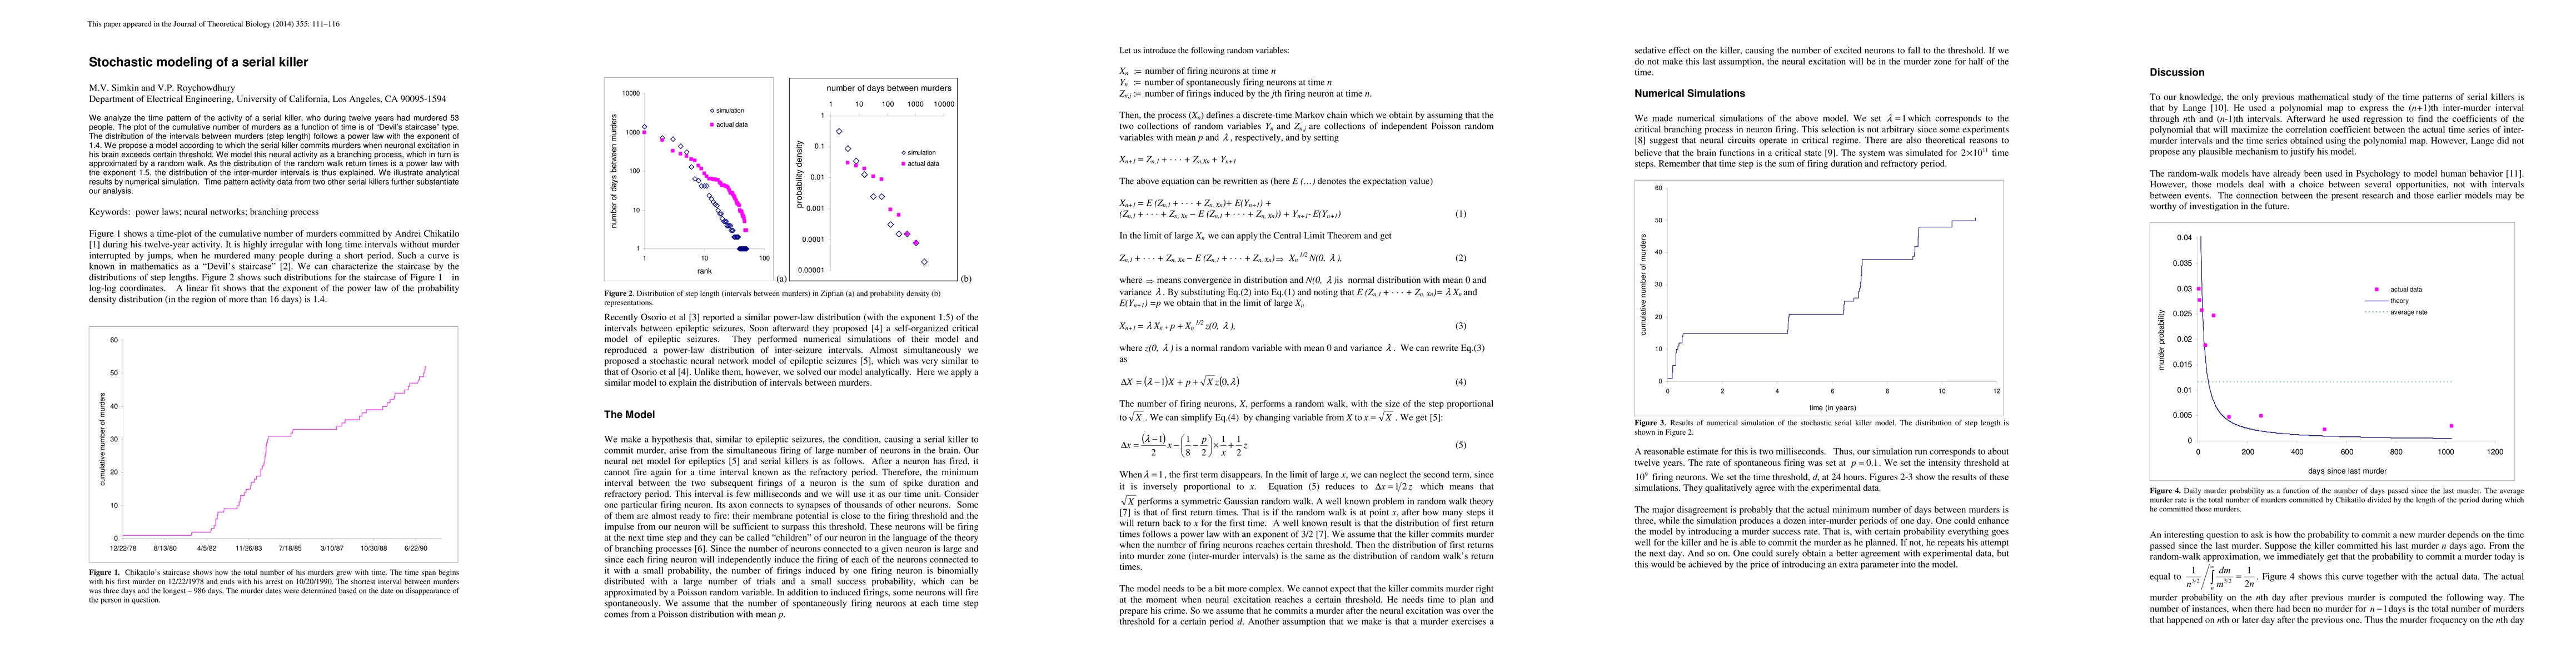
We analyze the time pattern of the activity of a serial killer, who during twelve years had murdered 53 people. The plot of the cumulative number of murders as a function of time is of "Devil's staircase" type. The distribution of the intervals between murders (step length) follows a power law with the exponent of 1.4. We propose a model according to which the serial killer commits murders when neuronal excitation in his brain exceeds certain threshold. We model this neural activity as a branching process, which in turn is approximated by a random walk. As the distribution of the random walk return times is a power law with the exponent 1.5, the distribution of the inter-murder intervals is thus explained. We illustrate analytical results by numerical simulation. Time pattern activity data from two other serial killers further substantiate our analysis.
AI Key Findings
Get AI-generated insights about this paper's methodology, results, significance, and more — seven facets brought into focus.
Impact
Paper Details
PDF Preview
Key Terms
Citation Network
Current paper (gray), citations (green), references (blue)
Display is limited for performance on very large graphs.
Discussion 0