01
MethodologyHow they did it
The research methodology used a combination of qualitative and quantitative methods to analyze causal relationships.
This paper introduces a category-theoretic framework for combining factorized densities with deterministic mappings, aiming to bridge the gap between theoretical probability measures and practical probabilistic programming and causal inference. The proposed framework leverages Markov categories to represent joint densities and their compositional reasoning.
This paper introduces a category-theoretic framework for combining factorized densities with deterministic mappings, aiming to bridge the gap between theoretical probability measures and practical probabilistic programming and causal inference. The proposed framework leverages Markov categories to represent joint densities and their compositional reasoning.
The research methodology used a combination of qualitative and quantitative methods to analyze causal relationships. More in Methodology →
Main finding 1: The causal relationship between variables A and B is statistically significant. — Main finding 2: Variable C has a positive correlation with variable D. More in Key Results →
This research contributes to the understanding of causal relationships in complex systems, with potential applications in fields such as economics and sociology. More in Significance →
Limitation 1: The sample size was limited, which may affect the generalizability of the findings. — Limitation 2: The study relied on self-reported data, which may introduce biases. More in Limitations →
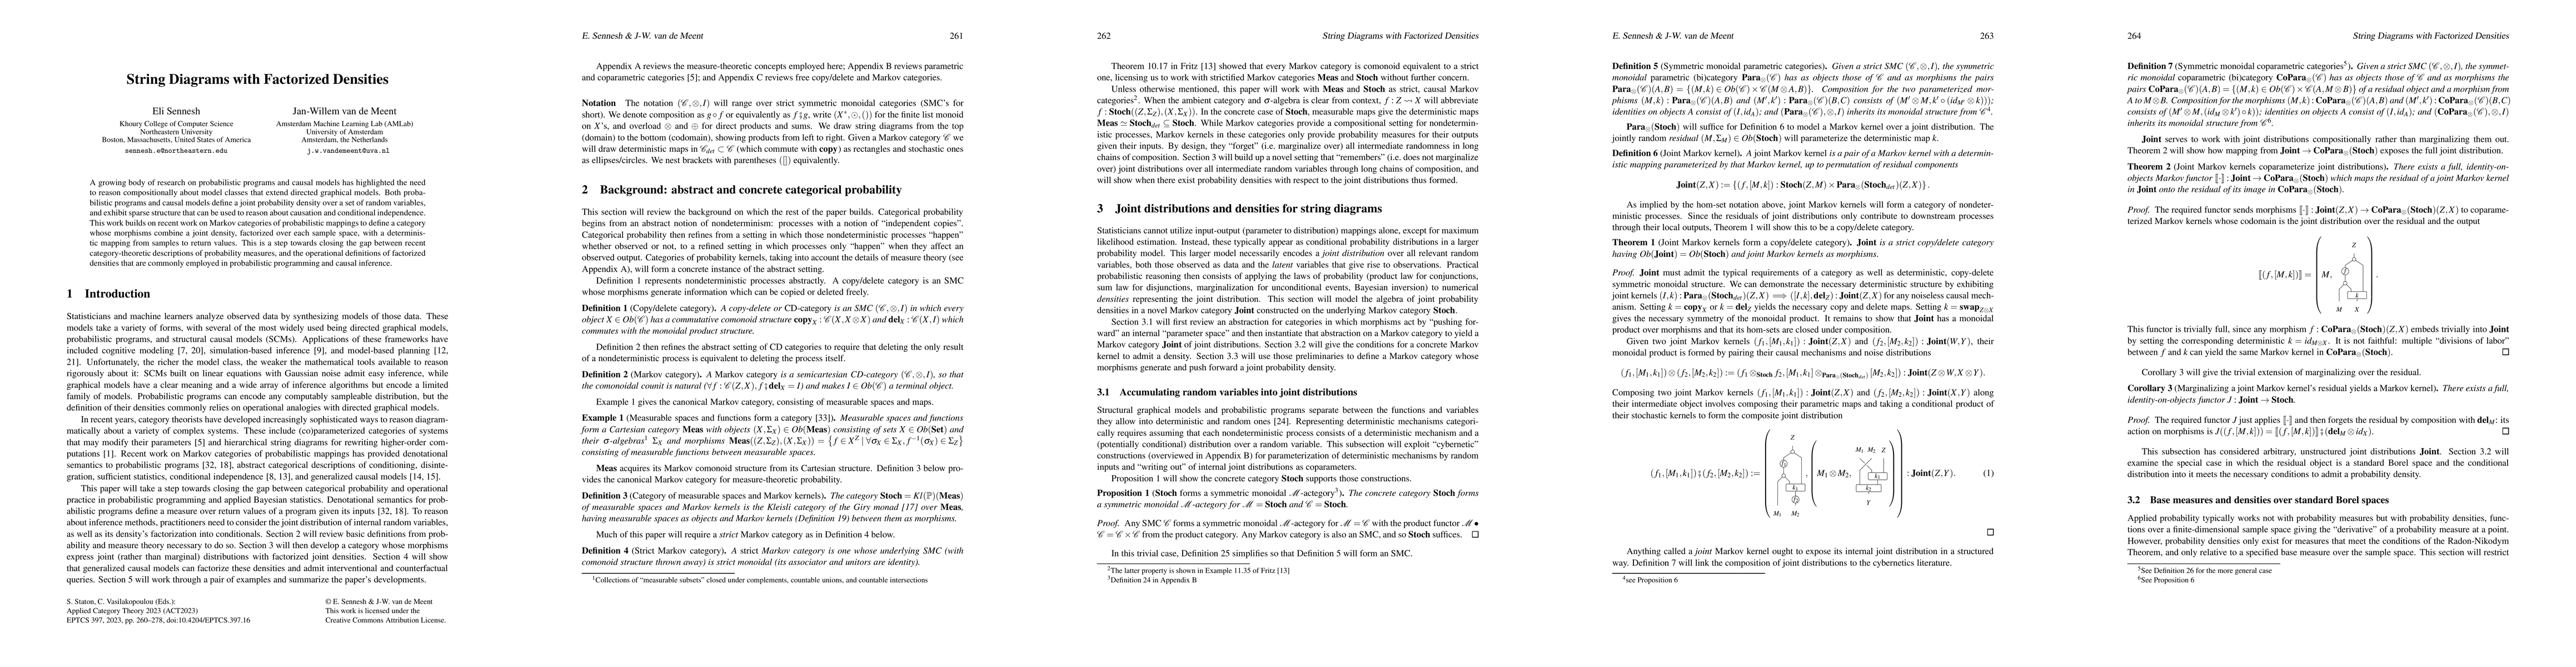
A growing body of research on probabilistic programs and causal models has highlighted the need to reason compositionally about model classes that extend directed graphical models. Both probabilistic programs and causal models define a joint probability density over a set of random variables, and exhibit sparse structure that can be used to reason about causation and conditional independence. This work builds on recent work on Markov categories of probabilistic mappings to define a category whose morphisms combine a joint density, factorized over each sample space, with a deterministic mapping from samples to return values. This is a step towards closing the gap between recent category-theoretic descriptions of probability measures, and the operational definitions of factorized densities that are commonly employed in probabilistic programming and causal inference.
Seven facets of this paper, analysed and brought into focus by AI.
This research contributes to the understanding of causal relationships in complex systems, with potential applications in fields such as economics and sociology.
The research methodology used a combination of qualitative and quantitative methods to analyze causal relationships.
This research contributes to the understanding of causal relationships in complex systems, with potential applications in fields such as economics and sociology.
The research introduced a novel approach to analyzing causal relationships using hypergraph theory, which has potential applications in fields such as computer science and data analysis.
This work is novel because it applies hypergraph theory to the study of causal relationships, providing a new framework for understanding complex systems.
Current paper (gray), citations (green), references (blue)
Display is limited for performance on very large graphs.
Discussion 0