Publication
Metrics
AI Quick Summary
This paper reports on the first strong lens time delay challenge, TDC1, where teams analyzed simulated light curves to determine time delays. Results show competitive methods achieving sub-percent accuracy, with LSST expected to yield around 400 robust time-delay measurements. Observing strategies significantly impact accuracy, success rate, and precision.
Paper Preview
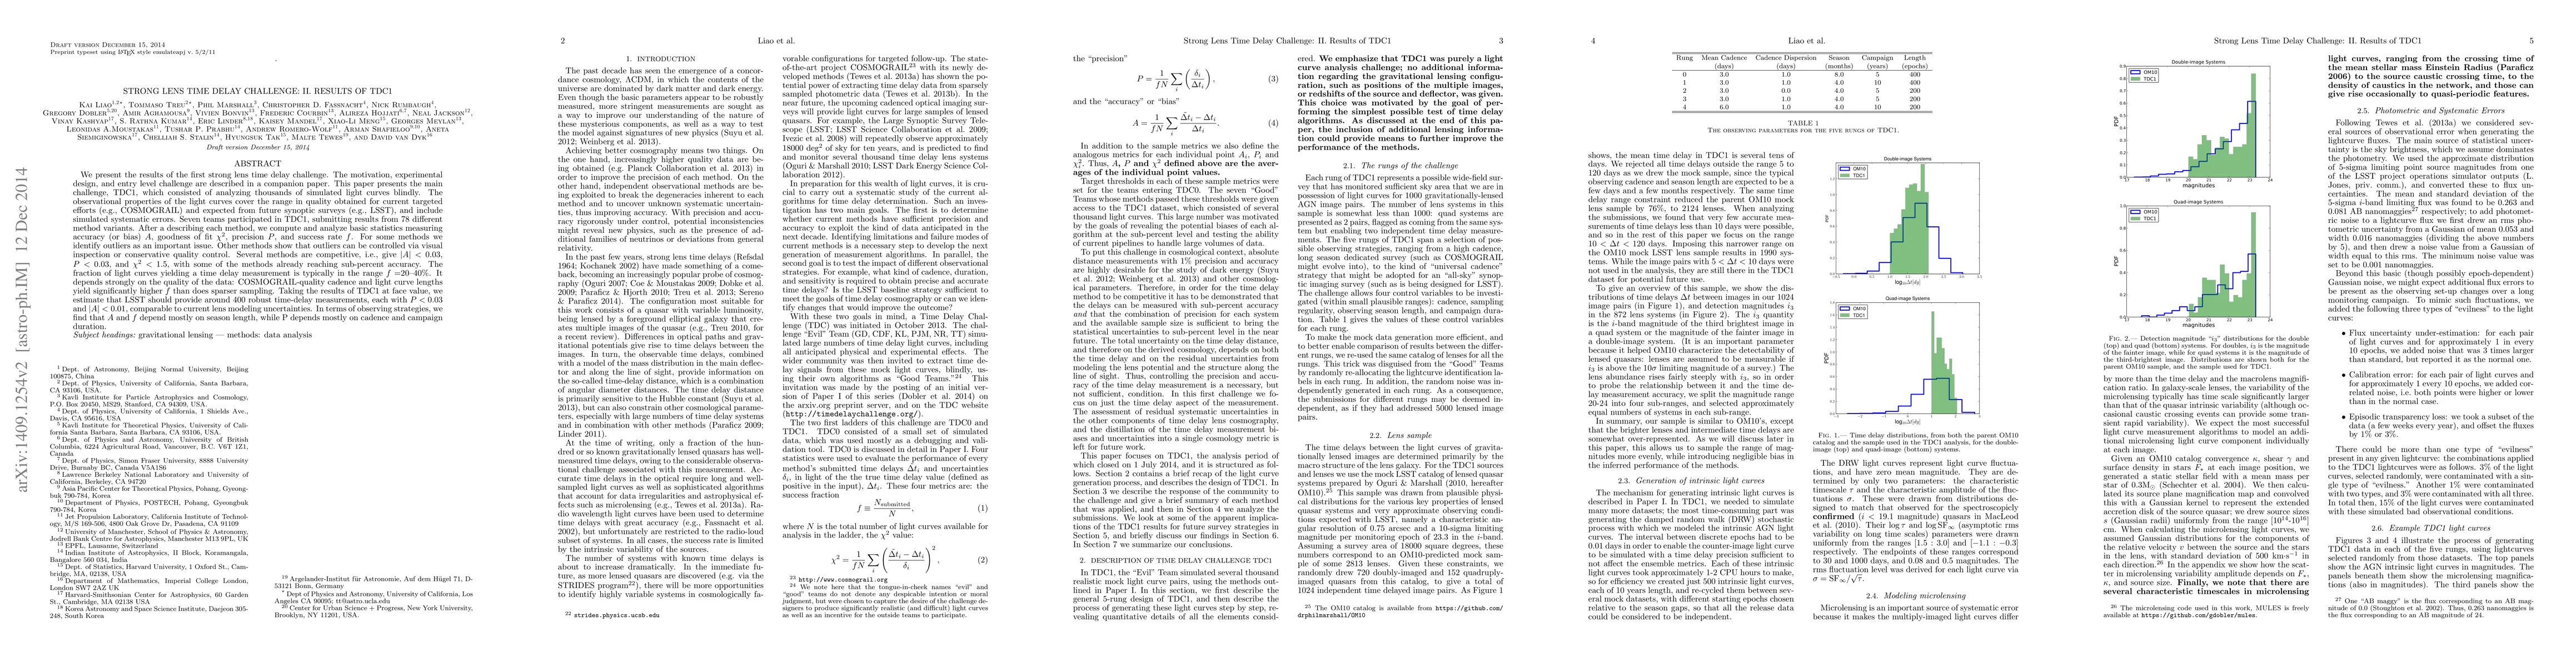
Abstract
We present the results of the first strong lens time delay challenge. The motivation, experimental design, and entry level challenge are described in a companion paper. This paper presents the main challenge, TDC1, which consisted of analyzing thousands of simulated light curves blindly. The observational properties of the light curves cover the range in quality obtained for current targeted efforts (e.g.,~COSMOGRAIL) and expected from future synoptic surveys (e.g.,~LSST), and include simulated systematic errors. \nteamsA\ teams participated in TDC1, submitting results from \nmethods\ different method variants. After a describing each method, we compute and analyze basic statistics measuring accuracy (or bias) $A$, goodness of fit $\chi^2$, precision $P$, and success rate $f$. For some methods we identify outliers as an important issue. Other methods show that outliers can be controlled via visual inspection or conservative quality control. Several methods are competitive, i.e., give $|A|<0.03$, $P<0.03$, and $\chi^2<1.5$, with some of the methods already reaching sub-percent accuracy. The fraction of light curves yielding a time delay measurement is typically in the range $f = $20--40\%. It depends strongly on the quality of the data: COSMOGRAIL-quality cadence and light curve lengths yield significantly higher $f$ than does sparser sampling. Taking the results of TDC1 at face value, we estimate that LSST should provide around 400 robust time-delay measurements, each with $P<0.03$ and $|A|<0.01$, comparable to current lens modeling uncertainties. In terms of observing strategies, we find that $A$ and $f$ depend mostly on season length, while P depends mostly on cadence and campaign duration.
AI Key Findings
Get AI-generated insights about this paper's methodology, results, significance, and more — seven facets brought into focus.
Impact
Paper Details
PDF Preview
Key Terms
Citation Network
Current paper (gray), citations (green), references (blue)
Display is limited for performance on very large graphs.
Discussion 0