Summary
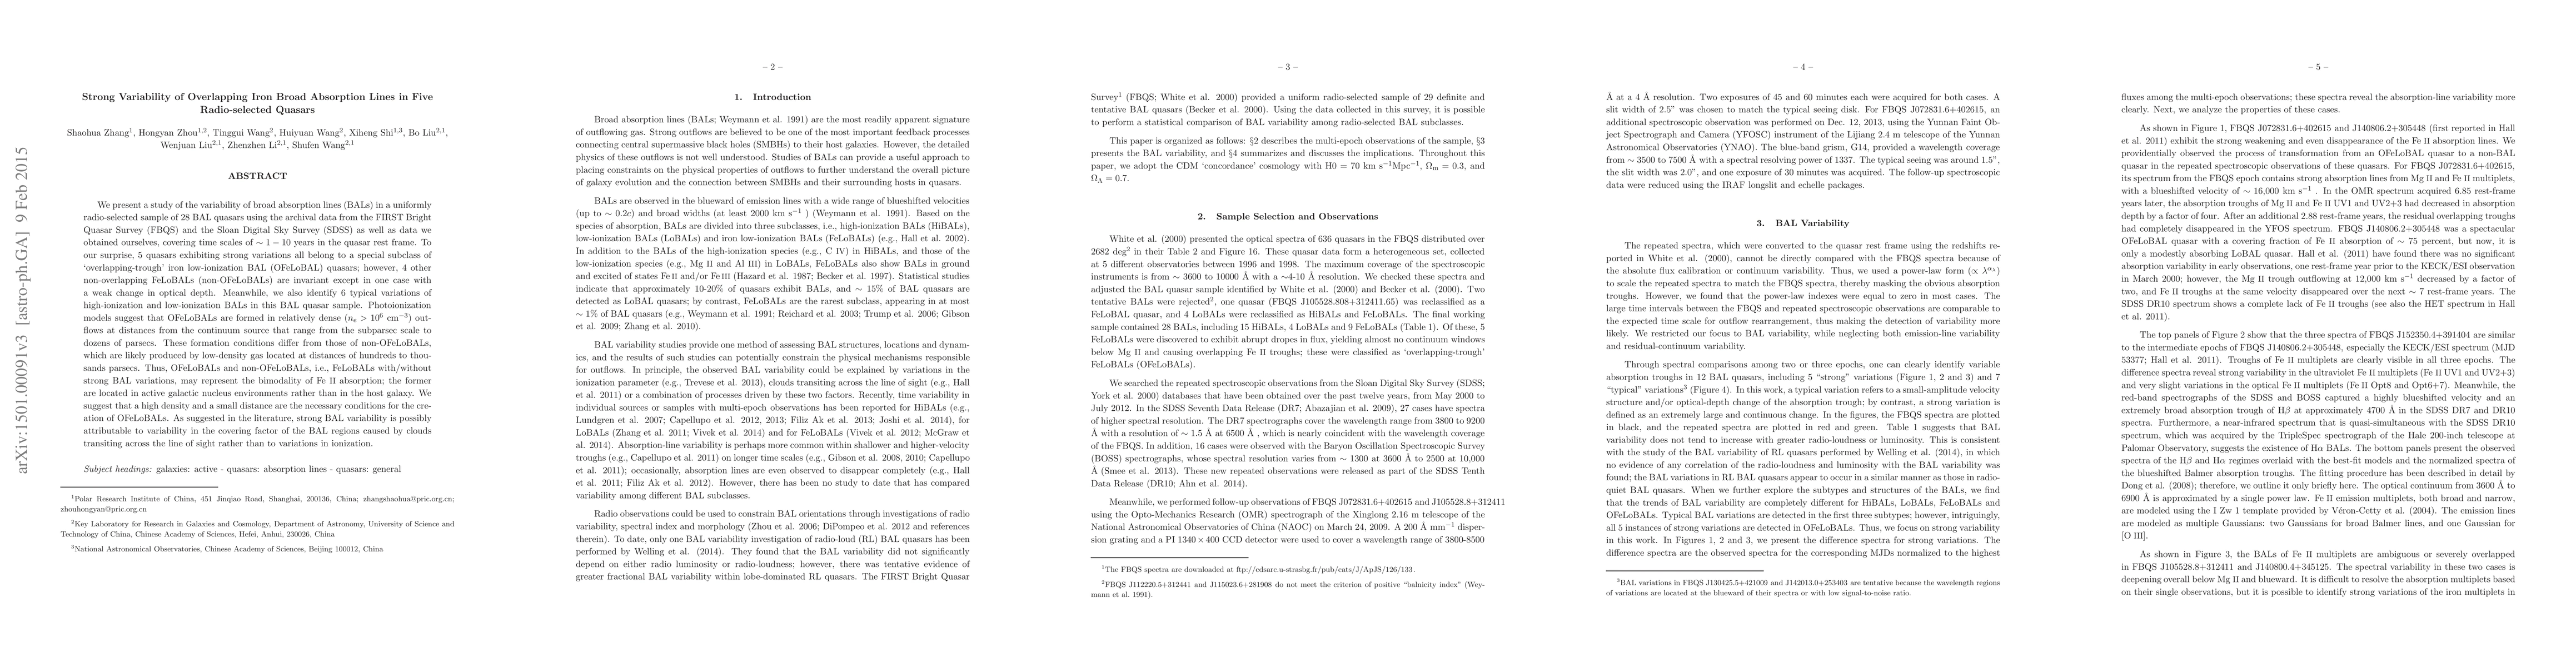
We present the variability study of broad absorption lines (BALs) in a uniformly radio-selected sample of 28 BAL quasars using the archival data from the FIRST Bright Quasar Survey (FBQS) and the Sloan Digital Sky Survey (SDSS), as well as those obtained by ourselves, covering time scales $\sim 1-10$ years in the quasar's rest-frame. To our surprise, 5 quasars showing strong variations are all belong to a special subclass of overlapping iron low ionization BAL (OFeLoBAL) quasars, however, other 4 non-overlapping FeLoBALs (non-OFeLoBALs) are invariable except one case with weak optical depth change. Meanwhile, we also find 6 typical variations of high-ionization and low-ionization BALs in this BAL quasar sample. Photoionization models suggest that OFeLoBALs are formed in a relative dense ($n_e>10^6$ cm$^{-3}$) outflows at a distance from the subparsec to the dozens of parsecs from the continuum source. They differ from those of non-OFeLoBALs, which are likely produced by low-density gas, locating at a distance of hundreds to thousands parsecs. Thus, OFeLoBALs and non-OFeLoBALs, i.e., FeLoBALs with/without strong BAL variations, perhaps represent the bimodality of Fe II absorption, the former is located in the active galactic nucleus environment rather than the host galaxy. We suggest that high density and small distance are the necessary conditions that cause OFeLoBALs. As suggested in the literature, strong BAL variability is possibly due to variability of the covering factor of BAL regions caused by clouds transiting across the line of sight rather than ionization variations.
AI Key Findings
Get AI-generated insights about this paper's methodology, results, and significance.
Paper Details
PDF Preview
Key Terms
Citation Network
Current paper (gray), citations (green), references (blue)
Display is limited for performance on very large graphs.
Similar Papers
Found 4 papers| Title | Authors | Year | Actions |
|---|
Comments (0)