Structural break analysis for spectrum and trace of covariance operators?
Publication
Metrics
AI Quick Summary
The paper proposes methods to analyze structural breaks in covariance operators of sequentially observed functional data, using sample eigenvalues and covariance operator traces, with a simulation study confirming their effectiveness.
Paper Preview
Abstract
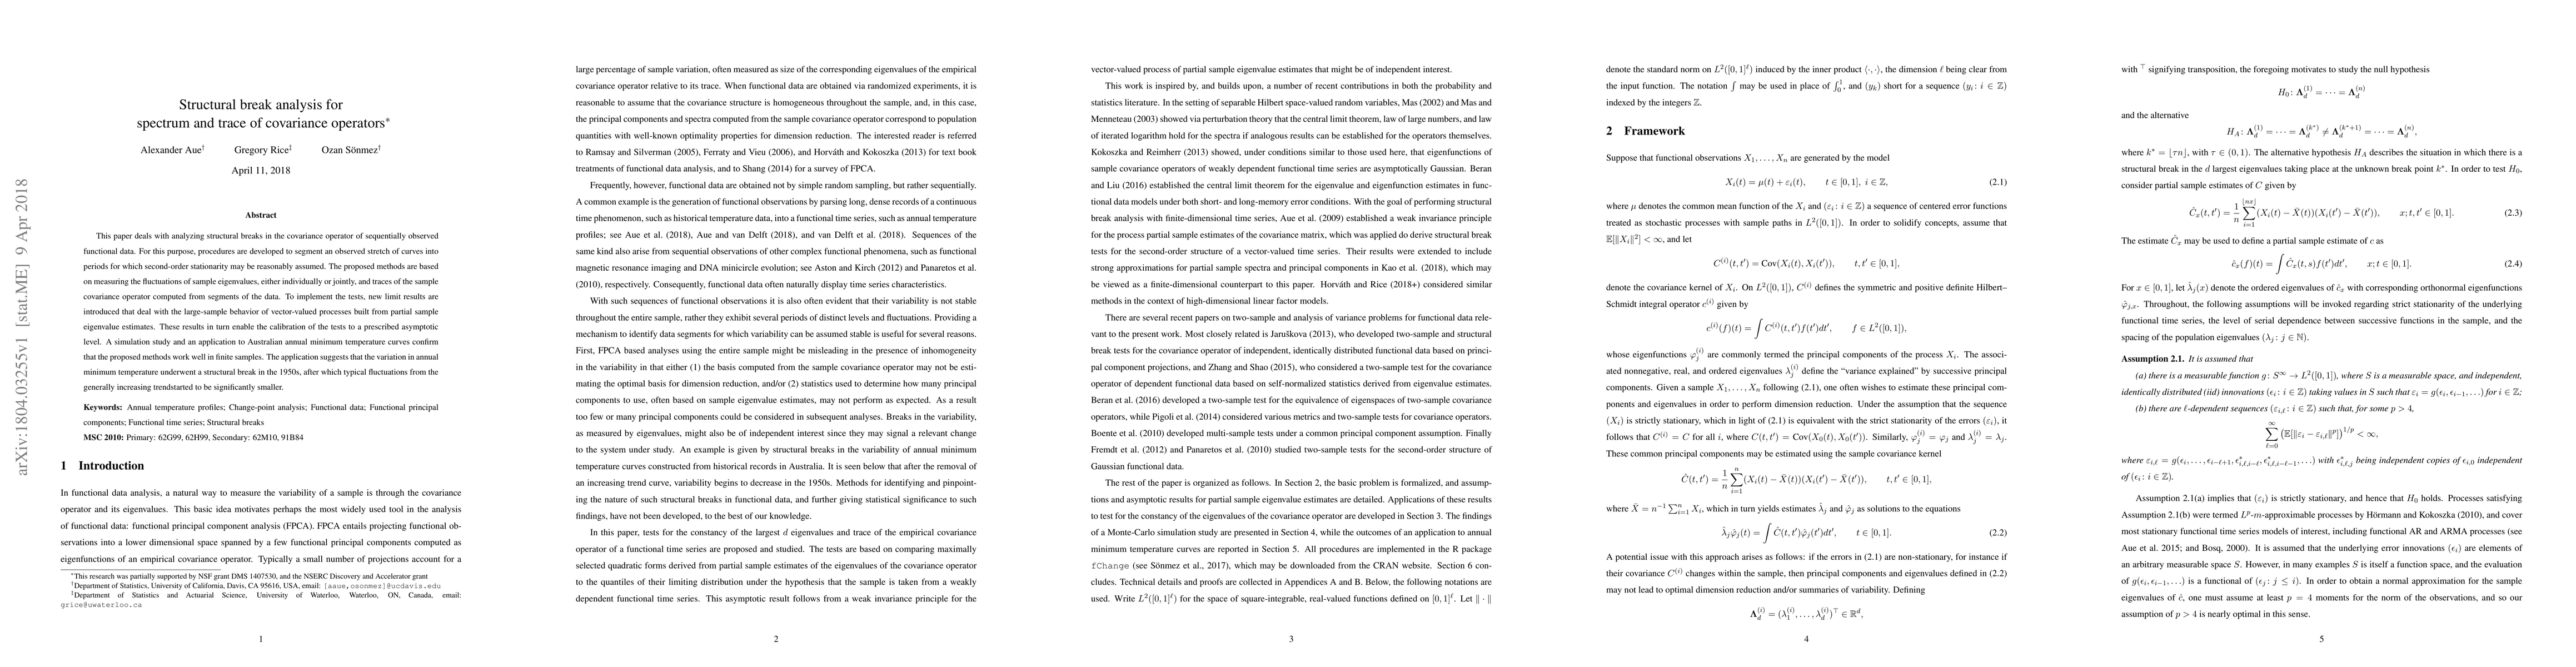
This paper deals with analyzing structural breaks in the covariance operator of sequentially observed functional data. For this purpose, procedures are developed to segment an observed stretch of curves into periods for which second-order stationarity may be reasonably assumed. The proposed methods are based on measuring the fluctuations of sample eigenvalues, either individually or jointly, and traces of the sample covariance operator computed from segments of the data. To implement the tests, new limit results are introduced that deal with the large-sample behavior of vector-valued processes built from partial sample eigenvalue estimates. These results in turn enable the calibration of the tests to a prescribed asymptotic level. A simulation study and an application to Australian annual minimum temperature curves confirm that the proposed methods work well in finite samples. The application suggests that the variation in annual minimum temperature underwent a structural break in the 1950s, after which typical fluctuations from the generally increasing trendstarted to be significantly smaller.
AI Key Findings
Get AI-generated insights about this paper's methodology, results, significance, and more — seven facets brought into focus.
Impact
Paper Details
PDF Preview
Key Terms
Citation Network
Current paper (gray), citations (green), references (blue)
Display is limited for performance on very large graphs.
Discussion 0