Summary
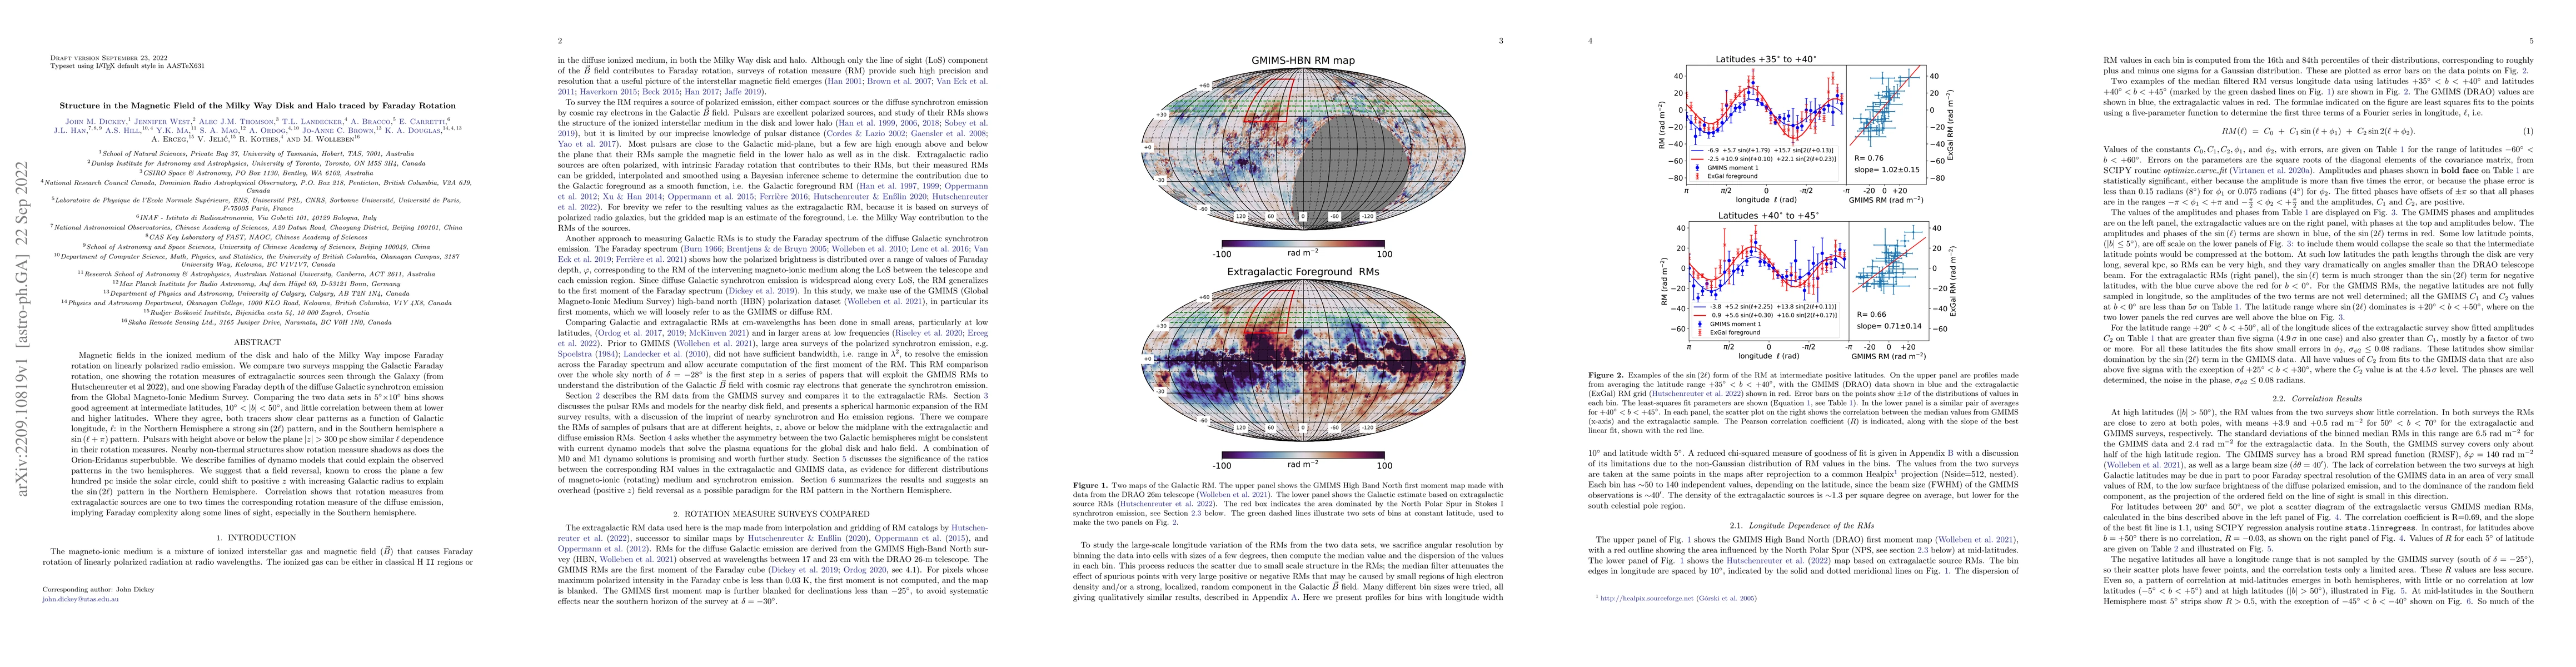
Magnetic fields in the ionized medium of the disk and halo of the Milky Way impose Faraday rotation on linearly polarized radio emission. We compare two surveys mapping the Galactic Faraday rotation, one showing the rotation measures of extragalactic sources seen through the Galaxy (from Hutschenreuter et al 2022), and one showing the Faraday depth of the diffuse Galactic synchrotron emission from the Global Magneto-Ionic Medium Survey. Comparing the two data sets in 5deg x 10deg bins shows good agreement at intermediate latitudes, 10 < |b| < 50 deg, and little correlation between them at lower and higher latitudes. Where they agree, both tracers show clear patterns as a function of Galactic longitude: in the Northern Hemisphere a strong sin(2 x longitude) pattern, and in the Southern hemisphere a sin(longitude + pi) pattern. Pulsars with height above or below the plane |z| > 300 pc show similar longitude dependence in their rotation measures. Nearby non-thermal structures show rotation measure shadows as does the Orion-Eridanus superbubble. We describe families of dynamo models that could explain the observed patterns in the two hemispheres. We suggest that a field reversal, known to cross the plane a few hundred pc inside the solar circle, could shift to positive z with increasing Galactic radius to explain the sin(2xlongitude) pattern in the Northern Hemisphere. Correlation shows that rotation measures from extragalactic sources are one to two times the corresponding rotation measure of the diffuse emission, implying Faraday complexity along some lines of sight, especially in the Southern hemisphere.
AI Key Findings
Get AI-generated insights about this paper's methodology, results, and significance.
Paper Details
PDF Preview
Key Terms
Citation Network
Current paper (gray), citations (green), references (blue)
Display is limited for performance on very large graphs.
Similar Papers
Found 4 papers| Title | Authors | Year | Actions |
|---|
Comments (0)