Structured factorization for single-cell gene expression data
Publication
Metrics
AI Quick Summary
This paper adapts a Bayesian generalized factor model to single-cell gene expression data, incorporating biological pathways to induce sparsity and interpret latent factors as unobserved cell covariates. The methodology is demonstrated on lung adenocarcinoma data, revealing insights into gene relationships and unobserved cell traits.
Paper Preview
Abstract
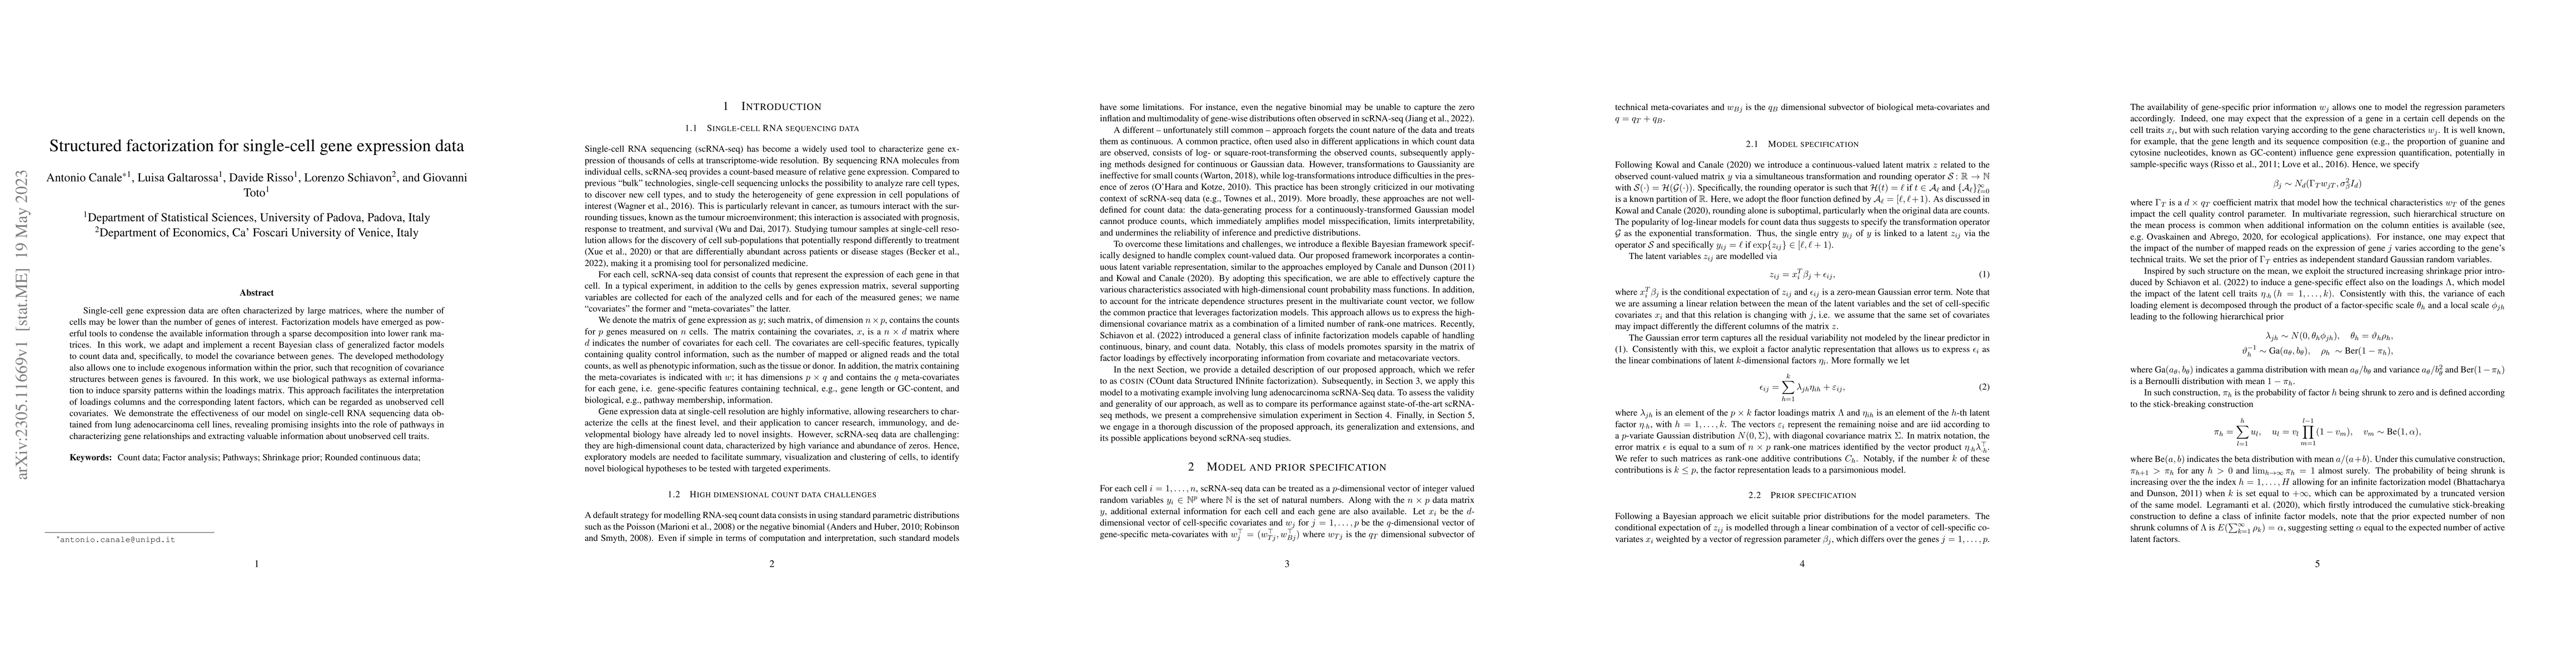
Single-cell gene expression data are often characterized by large matrices, where the number of cells may be lower than the number of genes of interest. Factorization models have emerged as powerful tools to condense the available information through a sparse decomposition into lower rank matrices. In this work, we adapt and implement a recent Bayesian class of generalized factor models to count data and, specifically, to model the covariance between genes. The developed methodology also allows one to include exogenous information within the prior, such that recognition of covariance structures between genes is favoured. In this work, we use biological pathways as external information to induce sparsity patterns within the loadings matrix. This approach facilitates the interpretation of loadings columns and the corresponding latent factors, which can be regarded as unobserved cell covariates. We demonstrate the effectiveness of our model on single-cell RNA sequencing data obtained from lung adenocarcinoma cell lines, revealing promising insights into the role of pathways in characterizing gene relationships and extracting valuable information about unobserved cell traits.
AI Key Findings
Get AI-generated insights about this paper's methodology, results, significance, and more — seven facets brought into focus.
Impact
Paper Details
Authors
PDF Preview
Key Terms
Citation Network
Current paper (gray), citations (green), references (blue)
Display is limited for performance on very large graphs.
Discussion 0