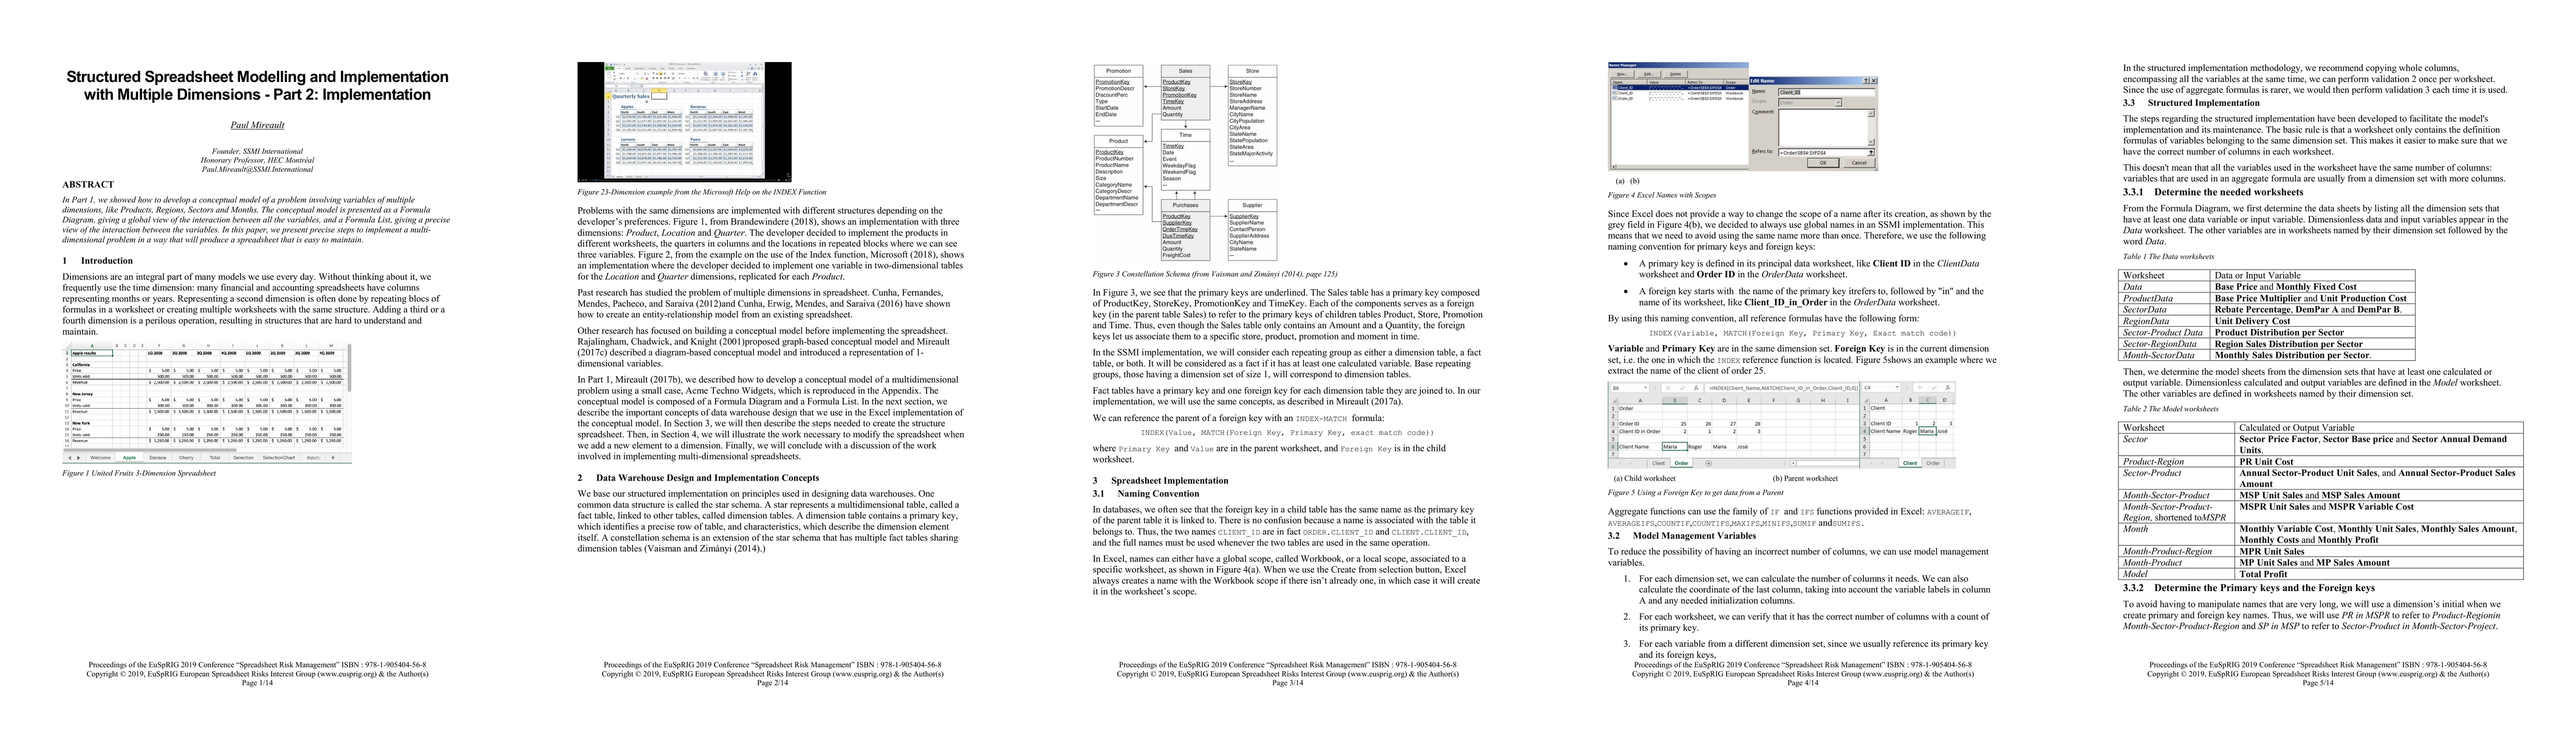
Structured Spreadsheet Modelling and Implementation with Multiple Dimensions -- Part 2: Implementation
Publication
Metrics
AI Quick Summary
Part 2 of the research paper outlines practical steps to implement a multi-dimensional spreadsheet model, following the conceptual Formula Diagram and Formula List developed in Part 1, ensuring the spreadsheet is straightforward to update and maintain.
Paper Preview
Abstract
In Part 1, we showed how to develop a conceptual model of a problem involving variables of multiple dimensions, like Products, Regions, Sectors and Months. The conceptual model is presented as a Formula Diagram, giving a global view of the interaction between all the variables, and a Formula List, giving a precise view of the interaction between the variables. In this paper, we present precise steps to implement a multi-dimensional problem in a way that will produce a spreadsheet that is easy to maintain
AI Key Findings
Get AI-generated insights about this paper's methodology, results, significance, and more — seven facets brought into focus.
Impact
Paper Details
Authors
PDF Preview
Key Terms
Citation Network
Current paper (gray), citations (green), references (blue)
Display is limited for performance on very large graphs.
Discussion 0