Summary
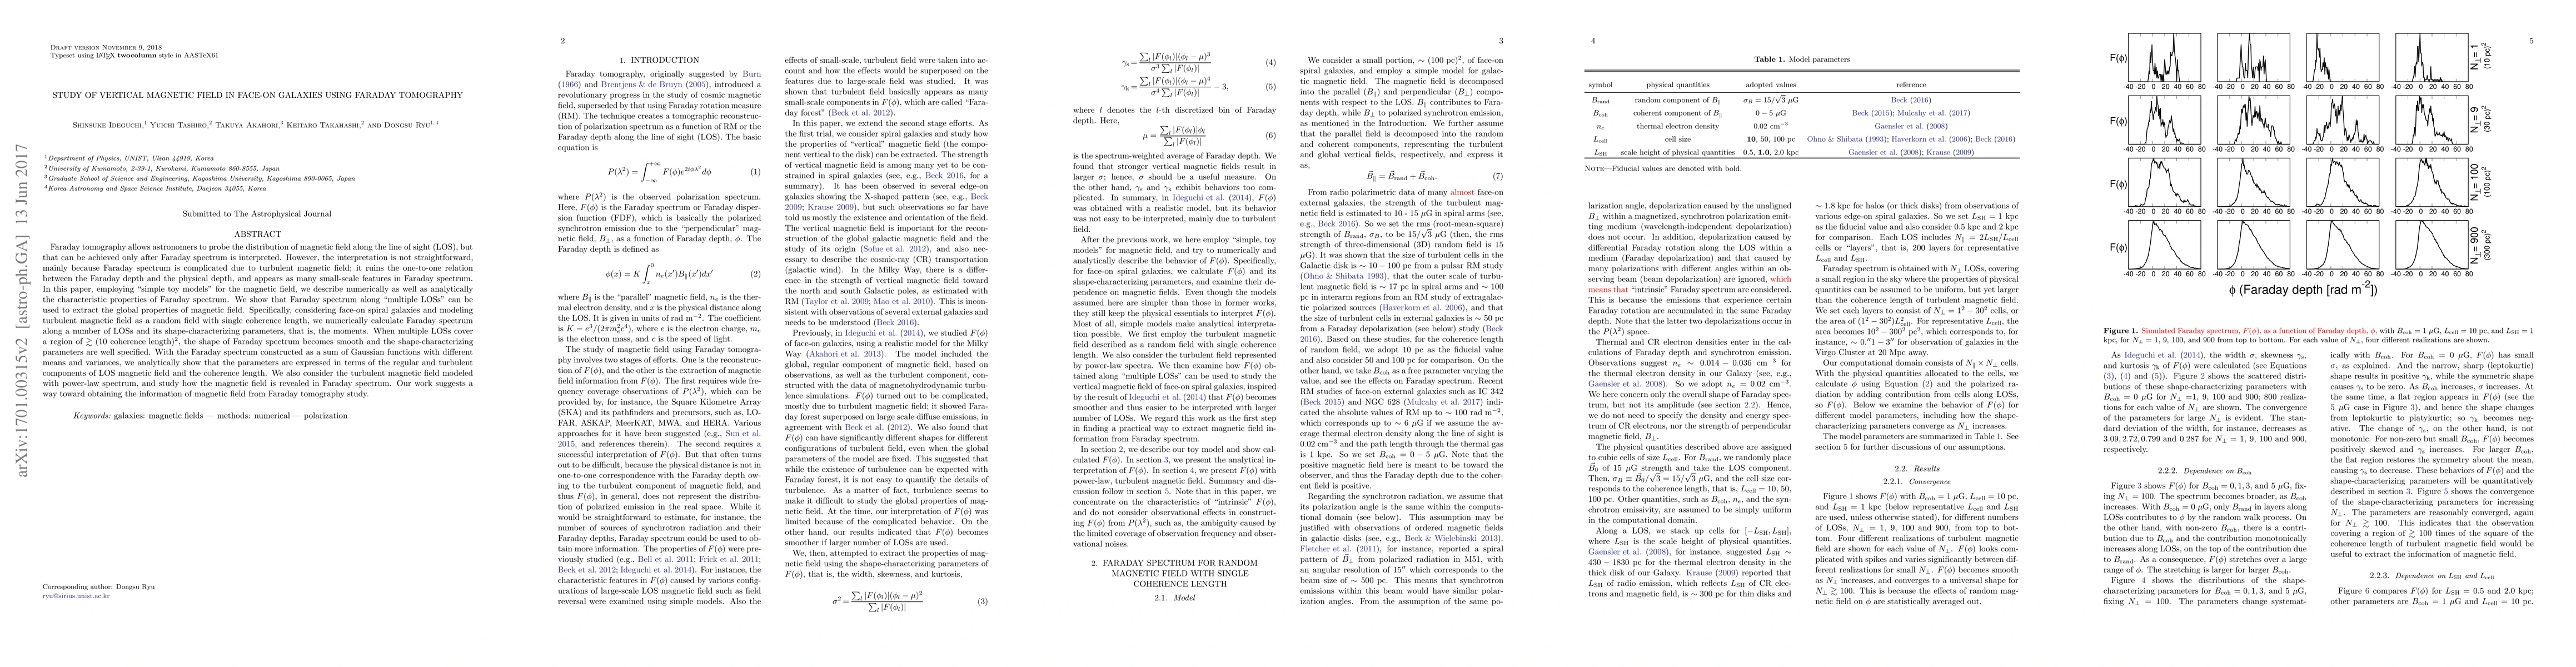
Faraday tomography allows astronomers to probe the distribution of magnetic field along the line of sight (LOS), but that can be achieved only after Faraday spectrum is interpreted. However, the interpretation is not straightforward, mainly because Faraday spectrum is complicated due to turbulent magnetic field; it ruins the one-to-one relation between the Faraday depth and the physical depth, and appears as many small-scale features in Faraday spectrum. In this paper, employing "simple toy models" for the magnetic field, we describe numerically as well as analytically the characteristic properties of Faraday spectrum. We show that Faraday spectrum along "multiple loss" can be used to extract the global properties of magnetic field. Specifically, considering face-on spiral galaxies and modeling turbulent magnetic field as a random field with single coherence length, we numerically calculate Faraday spectrum along a number of LOSs and its shape-characterizing parameters, that is, the moments. When multiple LOSs cover a region of $\gtrsim (10\ {\rm coherence\ length)^2}$, the shape of Faraday spectrum becomes smooth and the shape-characterizing parameters are well specified. With the Faraday spectrum constructed as a sum of Gaussian functions with different means and variances, we analytically show that the parameters are expressed in terms of the regular and turbulent components of LOS magnetic field and the coherence length. We also consider the turbulent magnetic field modeled with power-law spectrum, and study how the magnetic field is revealed in Faraday spectrum. Our work suggests a way toward obtaining the information of magnetic field from Faraday tomography study.
AI Key Findings
Get AI-generated insights about this paper's methodology, results, and significance.
Paper Details
PDF Preview
Key Terms
Citation Network
Current paper (gray), citations (green), references (blue)
Display is limited for performance on very large graphs.
Similar Papers
Found 4 papers| Title | Authors | Year | Actions |
|---|
Comments (0)