Publication
Metrics
AI Quick Summary
Researchers developed a method for reconstructing surface types from spectral data using PCA and a spectral library, achieving errors smaller than 2% in reconstruction and correlation coefficients larger than 0.99.
Paper Preview
Abstract
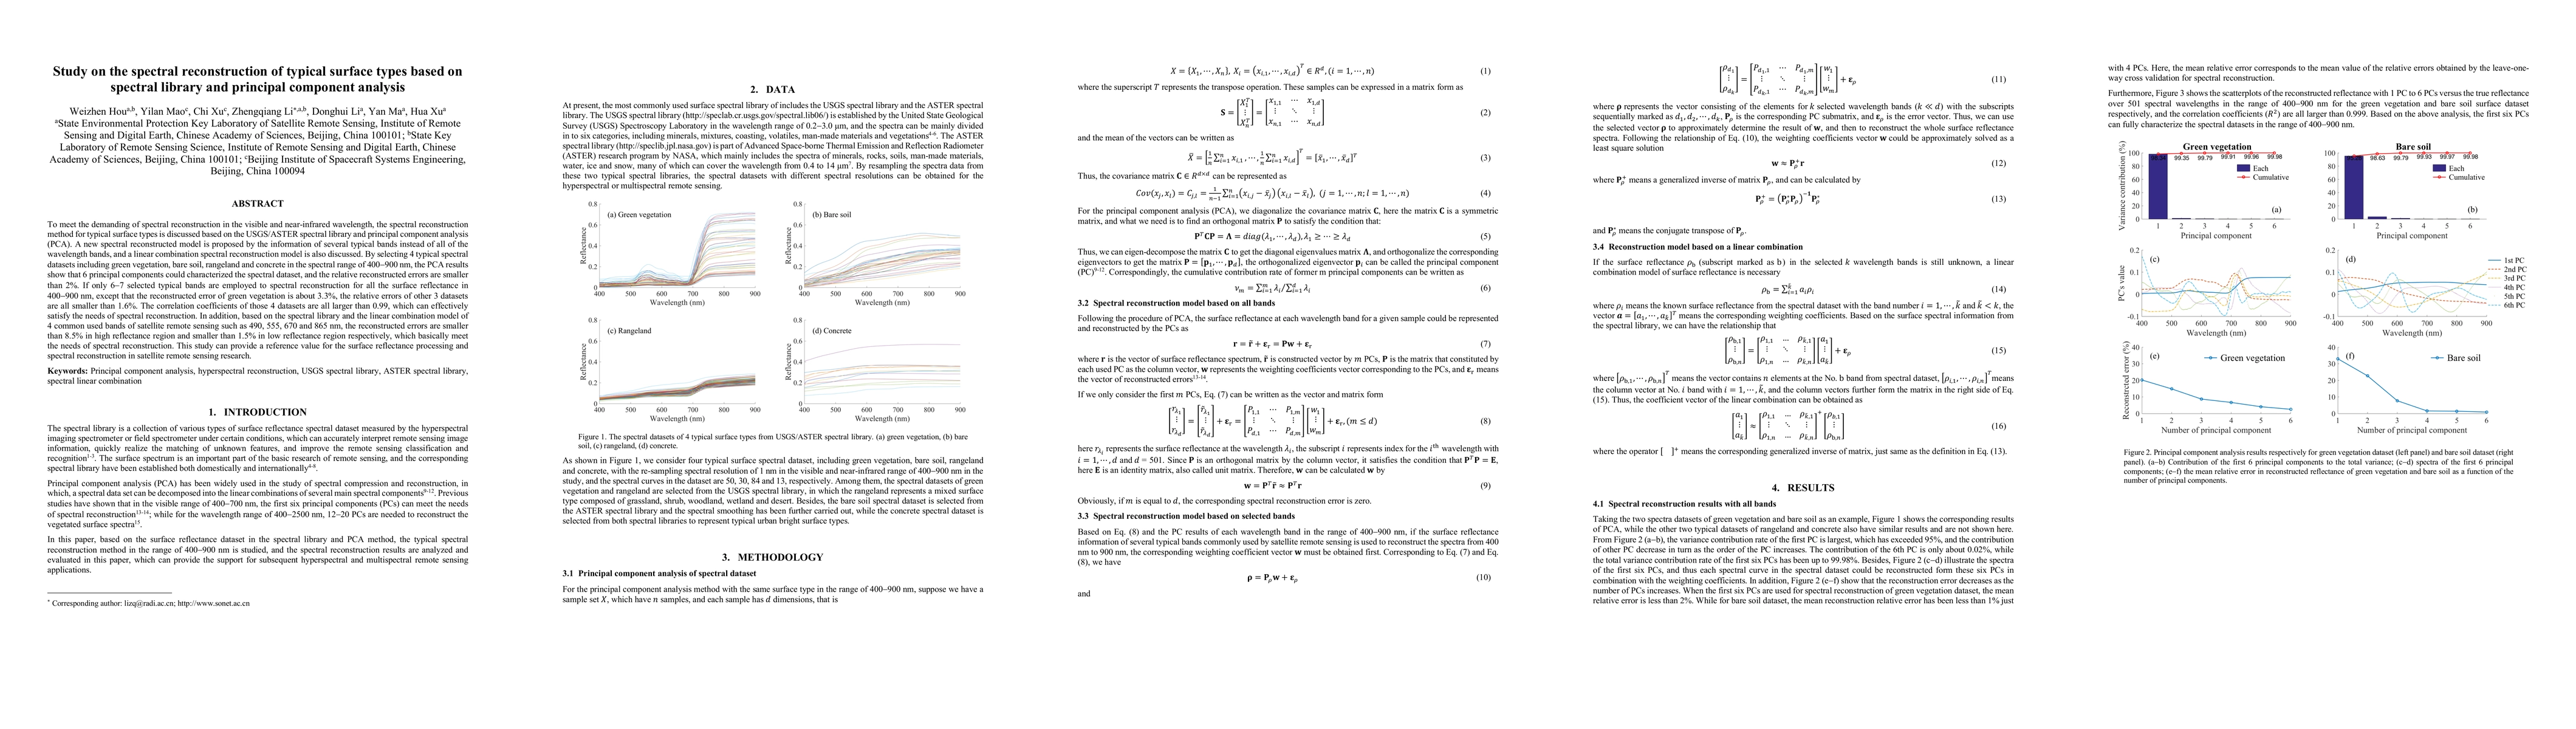
To meet the demanding of spectral reconstruction in the visible and near-infrared wavelength, the spectral reconstruction method for typical surface types is discussed based on the USGS /ASTER spectral library and principal component analysis (PCA). A new spectral reconstructed model is proposed by the information of several typical bands instead of all of the wavelength bands, and a linear combination spectral reconstruction model is also discussed. By selecting 4 typical spectral datasets including green vegetation, bare soil, rangeland and concrete in the spectral range of 400-900 nm, the PCA results show that 6 principal components could characterized the spectral dataset, and the relative reconstructed errors are smaller than 2%. If only 6-7 selected typical bands are employed to spectral reconstruction for all the surface reflectance in 400-900 nm, except that the reconstructed error of green vegetation is about 3.3%, the relative errors of other 3 datasets are all smaller than 1.6%. The correlation coefficients of those 4 datasets are all larger than 0.99, which can effectively satisfy the needs of spectral reconstruction. In addition, based on the spectral library and the linear combination model of 4 common used bands of satellite remote sensing such as 490, 555, 670 and 865 nm, the reconstructed errors are smaller than 8.5% in high reflectance region and smaller than 1.5% in low reflectance region respectively, which basically meet the needs of spectral reconstruction. This study can provide a reference value for the surface reflectance processing and spectral reconstruction in satellite remote sensing research.
AI Key Findings
Get AI-generated insights about this paper's methodology, results, significance, and more — seven facets brought into focus.
Impact
Paper Details
PDF Preview
Key Terms
Citation Network
Current paper (gray), citations (green), references (blue)
Display is limited for performance on very large graphs.
Discussion 0