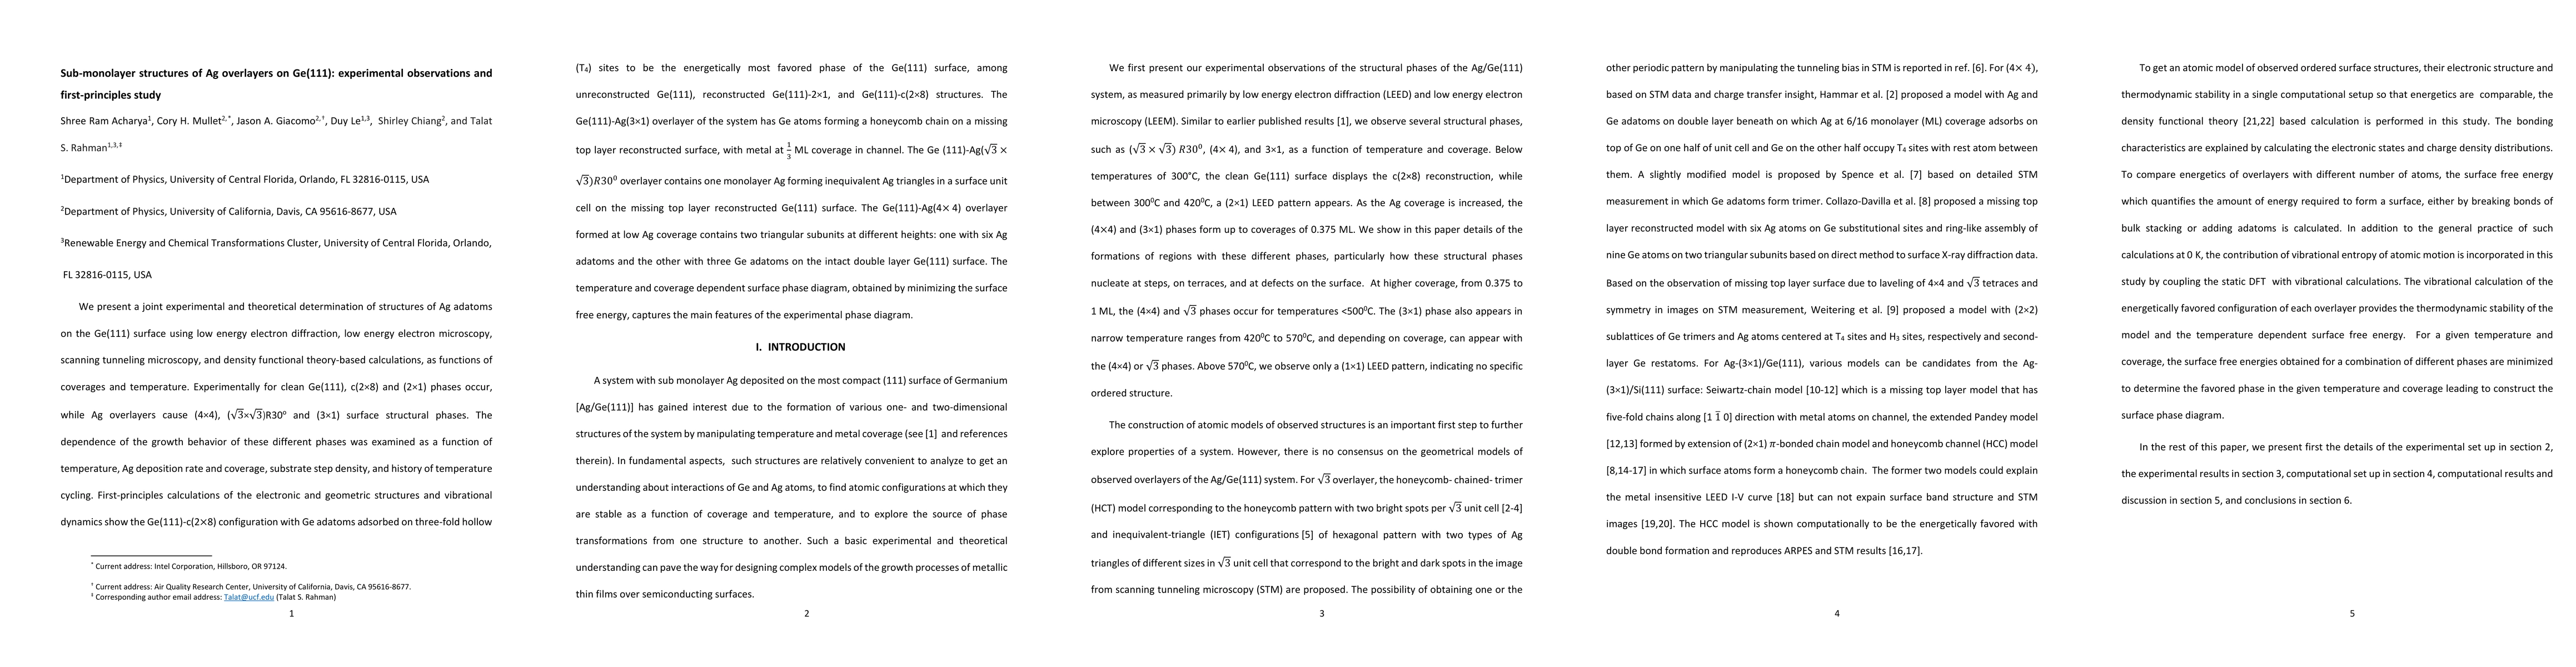
Sub-monolayer structures of Ag overlayers on Ge(111): experimental observations and first-principles study
Publication
Metrics
AI Quick Summary
This research combines experimental techniques and first-principles calculations to study the structures of Ag overlayers on Ge(111) surfaces. The study reveals various surface phases dependent on temperature, Ag coverage, and deposition rate, and theoretical calculations confirm the most stable configurations and growth behaviors.
Paper Preview
Abstract
We present a joint experimental and theoretical determination of structures of Ag adatoms on the Ge(111) surface using low energy electron diffraction, low energy electron microscopy, scanning tunneling microscopy, and density functional theory-based calculations, as functions of coverages and temperature. Experimentally for clean Ge(111), c(2X8) and (2X1) phases occur, while Ag overlayers cause (4X4), (V3XV3)R30 and (3X1) surface structural phases. The dependence of the growth behavior of these different phases was examined as a function of temperature, Ag deposition rate and coverage, substrate step density, and history of temperature cycling. First-principles calculations of the electronic and geometric structures and vibrational dynamics show the Ge(111)-c(2X8) configuration with Ge adatoms adsorbed on three-fold hollow (T4) sites to be the energetically most favored phase of the Ge(111) surface, among unreconstructed Ge(111), reconstructed Ge(111)-2X1, and Ge(111)-c(2X8) structures. The Ge(111)-Ag(3X1) overlayer of the system has Ge atoms forming a honeycomb chain on a missing top layer reconstructed surface, with metal at 1/3 ML coverage in channel. The Ge (111)-Ag(V3XV3)R30 overlayer contains one monolayer Ag forming inequivalent Ag triangles in a surface unit cell on the missing top layer reconstructed Ge(111) surface. The Ge(111)-Ag(4X4) overlayer formed at low Ag coverage contains two triangular subunits at different heights: one with six Ag adatoms and the other with three Ge adatoms on the intact double layer Ge(111) surface. The temperature and coverage dependent surface phase diagram, obtained by minimizing the surface free energy, captures the main features of the experimental phase diagram.
AI Key Findings
Get AI-generated insights about this paper's methodology, results, significance, and more — seven facets brought into focus.
Impact
Paper Details
PDF Preview
Key Terms
Citation Network
Current paper (gray), citations (green), references (blue)
Display is limited for performance on very large graphs.
Discussion 0