Subbotin Graphical Models for Extreme Value Dependencies with Applications to Functional Neuronal Connectivity
Publication
Metrics
AI Quick Summary
This paper introduces the Subbotin graphical model to estimate functional neuronal connectivity from calcium imaging data, focusing on extreme value observations indicating neuronal firing. The model avoids the need for data pre-processing and is shown to outperform existing methods in both simulation studies and real-world data analysis.
Paper Preview
Abstract
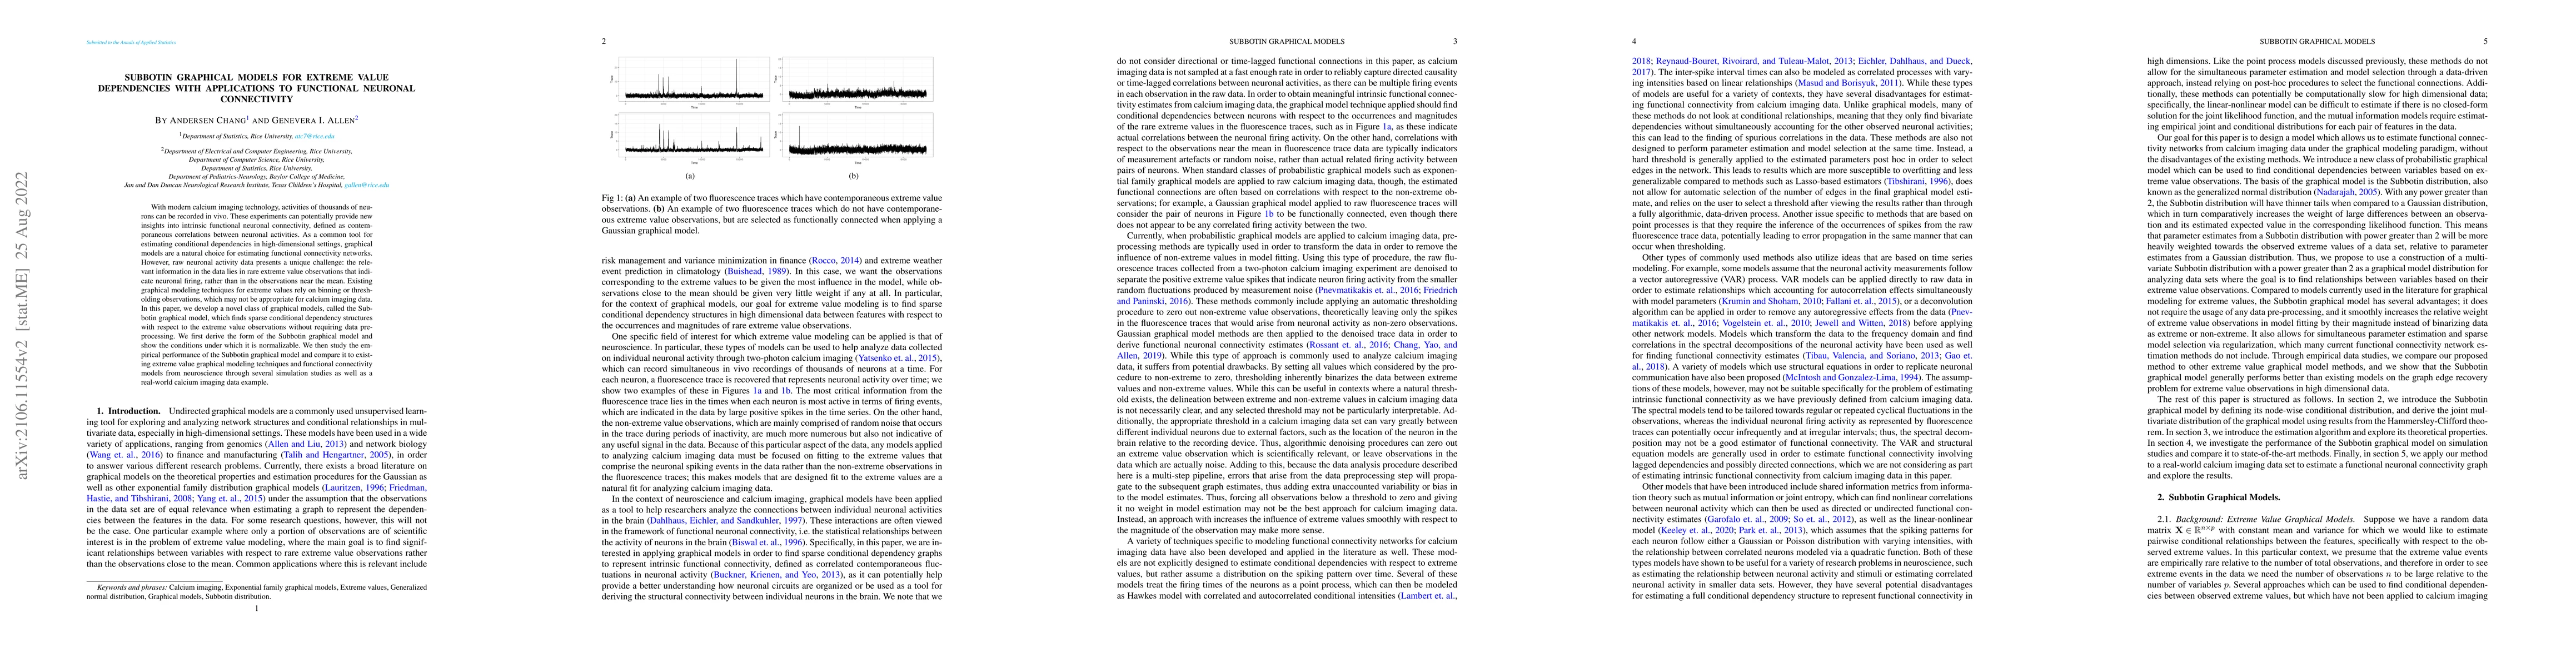
With modern calcium imaging technology, activities of thousands of neurons can be recorded in vivo. These experiments can potentially provide new insights into intrinsic functional neuronal connectivity, defined as contemporaneous correlations between neuronal activities. As a common tool for estimating conditional dependencies in high-dimensional settings, graphical models are a natural choice for estimating functional connectivity networks. However, raw neuronal activity data presents a unique challenge: the relevant information in the data lies in rare extreme value observations that indicate neuronal firing, rather than in the observations near the mean. Existing graphical modeling techniques for extreme values rely on binning or thresholding observations, which may not be appropriate for calcium imaging data. In this paper, we develop a novel class of graphical models, called the Subbotin graphical model, which finds sparse conditional dependency structures with respect to the extreme value observations without requiring data pre-processing. We first derive the form of the Subbotin graphical model and show the conditions under which it is normalizable. We then study the empirical performance of the Subbotin graphical model and compare it to existing extreme value graphical modeling techniques and functional connectivity models from neuroscience through several simulation studies as well as a real-world calcium imaging data example.
AI Key Findings
Get AI-generated insights about this paper's methodology, results, significance, and more — seven facets brought into focus.
Impact
Paper Details
Authors
PDF Preview
Key Terms
Citation Network
Current paper (gray), citations (green), references (blue)
Display is limited for performance on very large graphs.
Discussion 0