Publication
Metrics
AI Quick Summary
This paper develops approximate equations for the average number of subgraphs in random sparse directed networks, revealing new scaling rules for directed scale-free networks. It identifies three regimes based on the power exponent of the degree distribution, showing that certain subgraphs appear much more frequently than in classic Erdos networks, with results corroborated by numerical simulations.
Paper Preview
Abstract
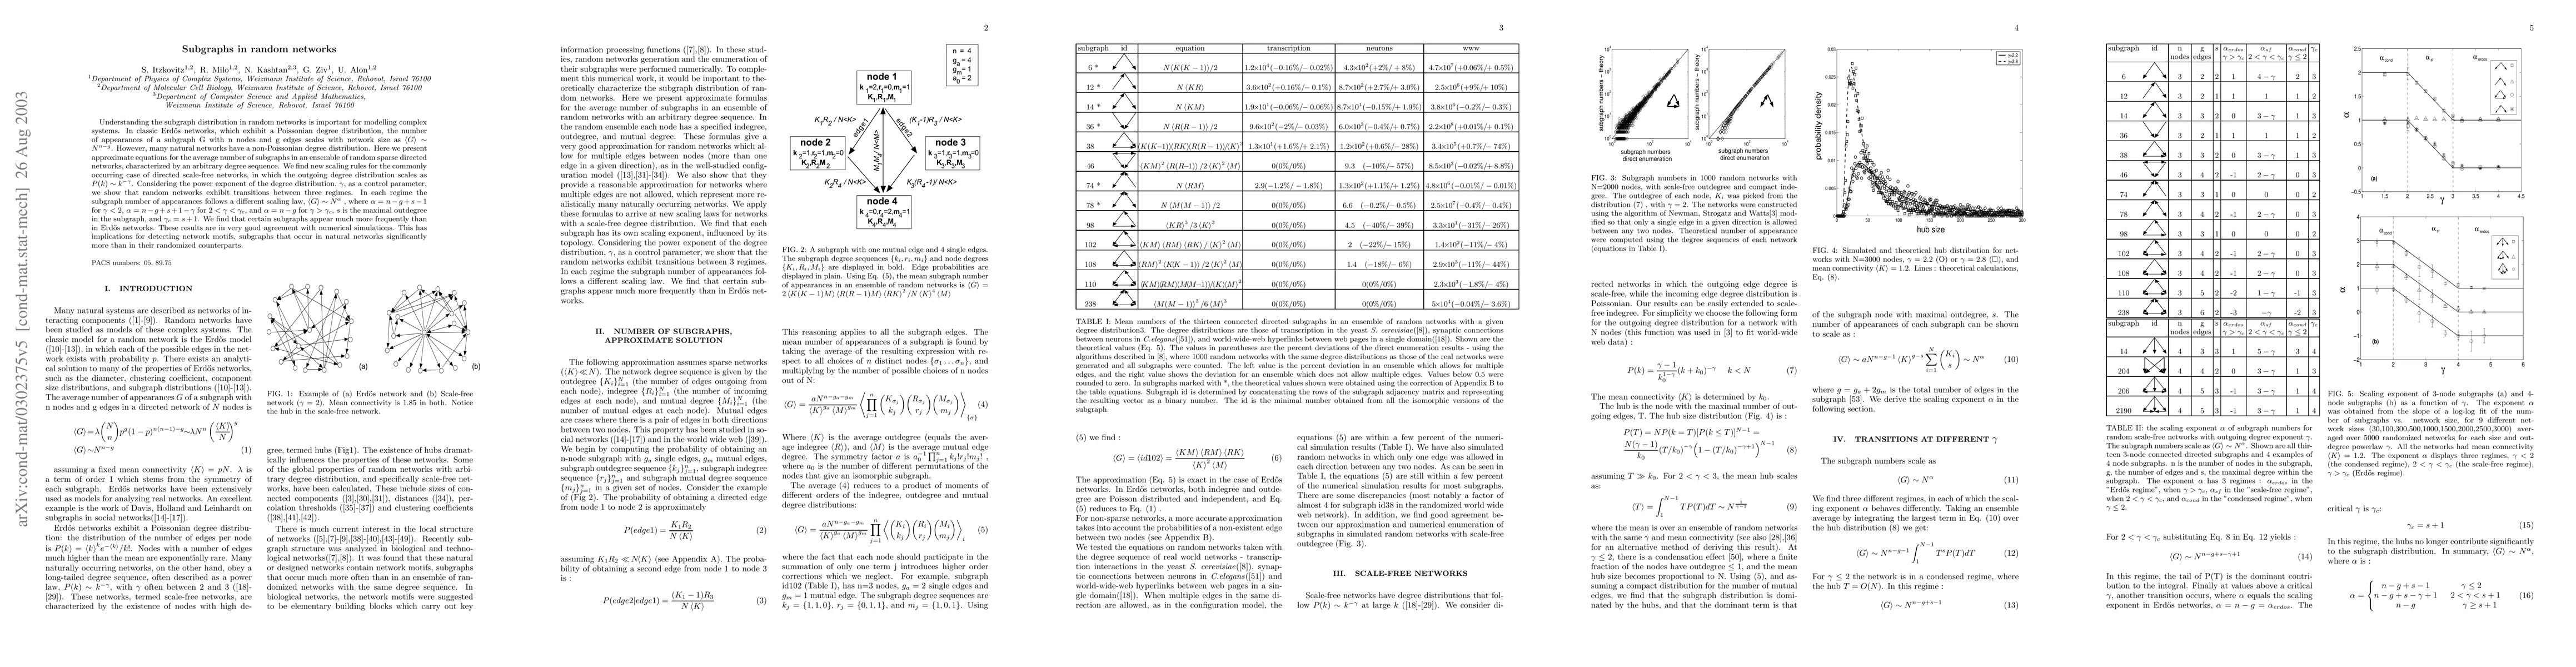
Understanding the subgraph distribution in random networks is important for modelling complex systems. In classic Erdos networks, which exhibit a Poissonian degree distribution, the number of appearances of a subgraph G with n nodes and g edges scales with network size as \mean{G} ~ N^{n-g}. However, many natural networks have a non-Poissonian degree distribution. Here we present approximate equations for the average number of subgraphs in an ensemble of random sparse directed networks, characterized by an arbitrary degree sequence. We find new scaling rules for the commonly occurring case of directed scale-free networks, in which the outgoing degree distribution scales as P(k) ~ k^{-\gamma}. Considering the power exponent of the degree distribution, \gamma, as a control parameter, we show that random networks exhibit transitions between three regimes. In each regime the subgraph number of appearances follows a different scaling law, \mean{G} ~ N^{\alpha}, where \alpha=n-g+s-1 for \gamma<2, \alpha=n-g+s+1-\gamma for 2<\gamma<\gamma_c, and \alpha=n-g for \gamma>\gamma_c, s is the maximal outdegree in the subgraph, and \gamma_c=s+1. We find that certain subgraphs appear much more frequently than in Erdos networks. These results are in very good agreement with numerical simulations. This has implications for detecting network motifs, subgraphs that occur in natural networks significantly more than in their randomized counterparts.
AI Key Findings
Get AI-generated insights about this paper's methodology, results, significance, and more — seven facets brought into focus.
Impact
Paper Details
Authors
PDF Preview
Citation Network
Current paper (gray), citations (green), references (blue)
Display is limited for performance on very large graphs.
Discussion 0