Publication
Metrics
AI Quick Summary
The paper proposes the subgroup balancing propensity score (SBPS) method to estimate subgroup treatment effects in observational data, addressing the limitation of existing methods that focus on overall treatment effects. The SBPS method optimizes covariate balance for both overall and subgroup samples, demonstrated through simulations to improve subgroup treatment effect estimation, and applied to Italy Survey data to assess debit card impact on household consumption across income groups.
Paper Preview
Abstract
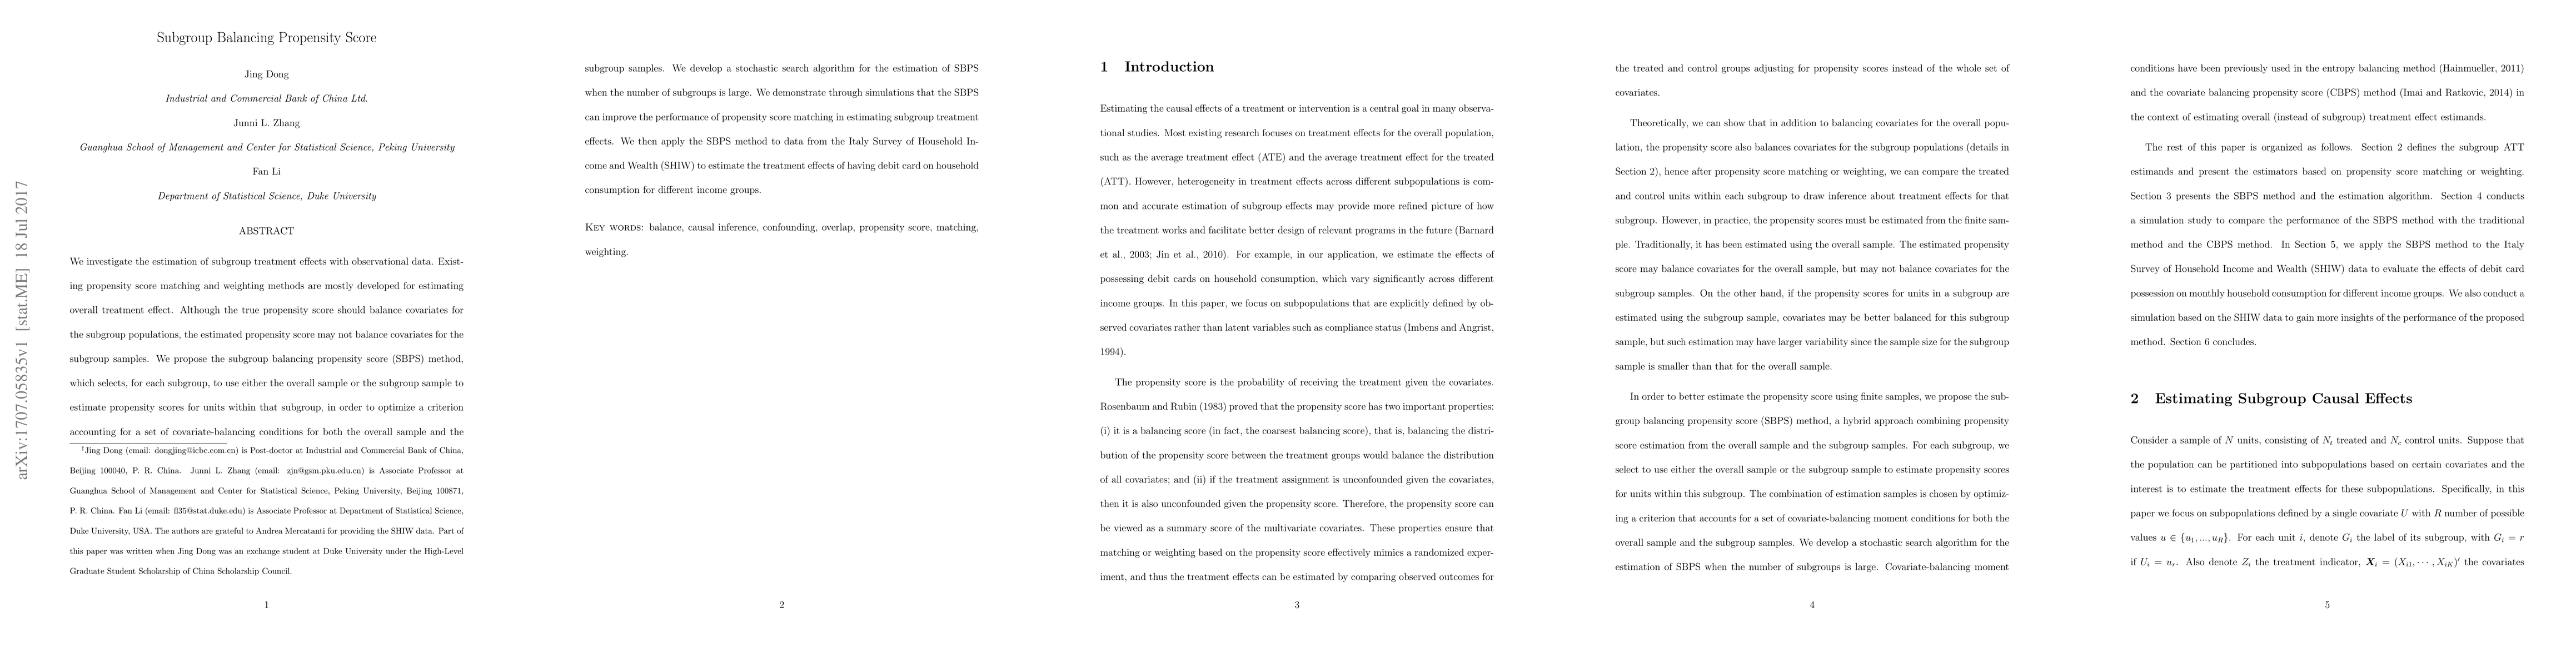
We investigate the estimation of subgroup treatment effects with observational data. Existing propensity score matching and weighting methods are mostly developed for estimating overall treatment effect. Although the true propensity score should balance covariates for the subgroup populations, the estimated propensity score may not balance covariates for the subgroup samples. We propose the subgroup balancing propensity score (SBPS) method, which selects, for each subgroup, to use either the overall sample or the subgroup sample to estimate propensity scores for units within that subgroup, in order to optimize a criterion accounting for a set of covariate-balancing conditions for both the overall sample and the subgroup samples. We develop a stochastic search algorithm for the estimation of SBPS when the number of subgroups is large. We demonstrate through simulations that the SBPS can improve the performance of propensity score matching in estimating subgroup treatment effects. We then apply the SBPS method to data from the Italy Survey of Household Income and Wealth (SHIW) to estimate the treatment effects of having debit card on household consumption for different income groups.
AI Key Findings
Get AI-generated insights about this paper's methodology, results, significance, and more — seven facets brought into focus.
Impact
Paper Details
PDF Preview
Key Terms
Citation Network
Current paper (gray), citations (green), references (blue)
Display is limited for performance on very large graphs.
Discussion 0