Summary
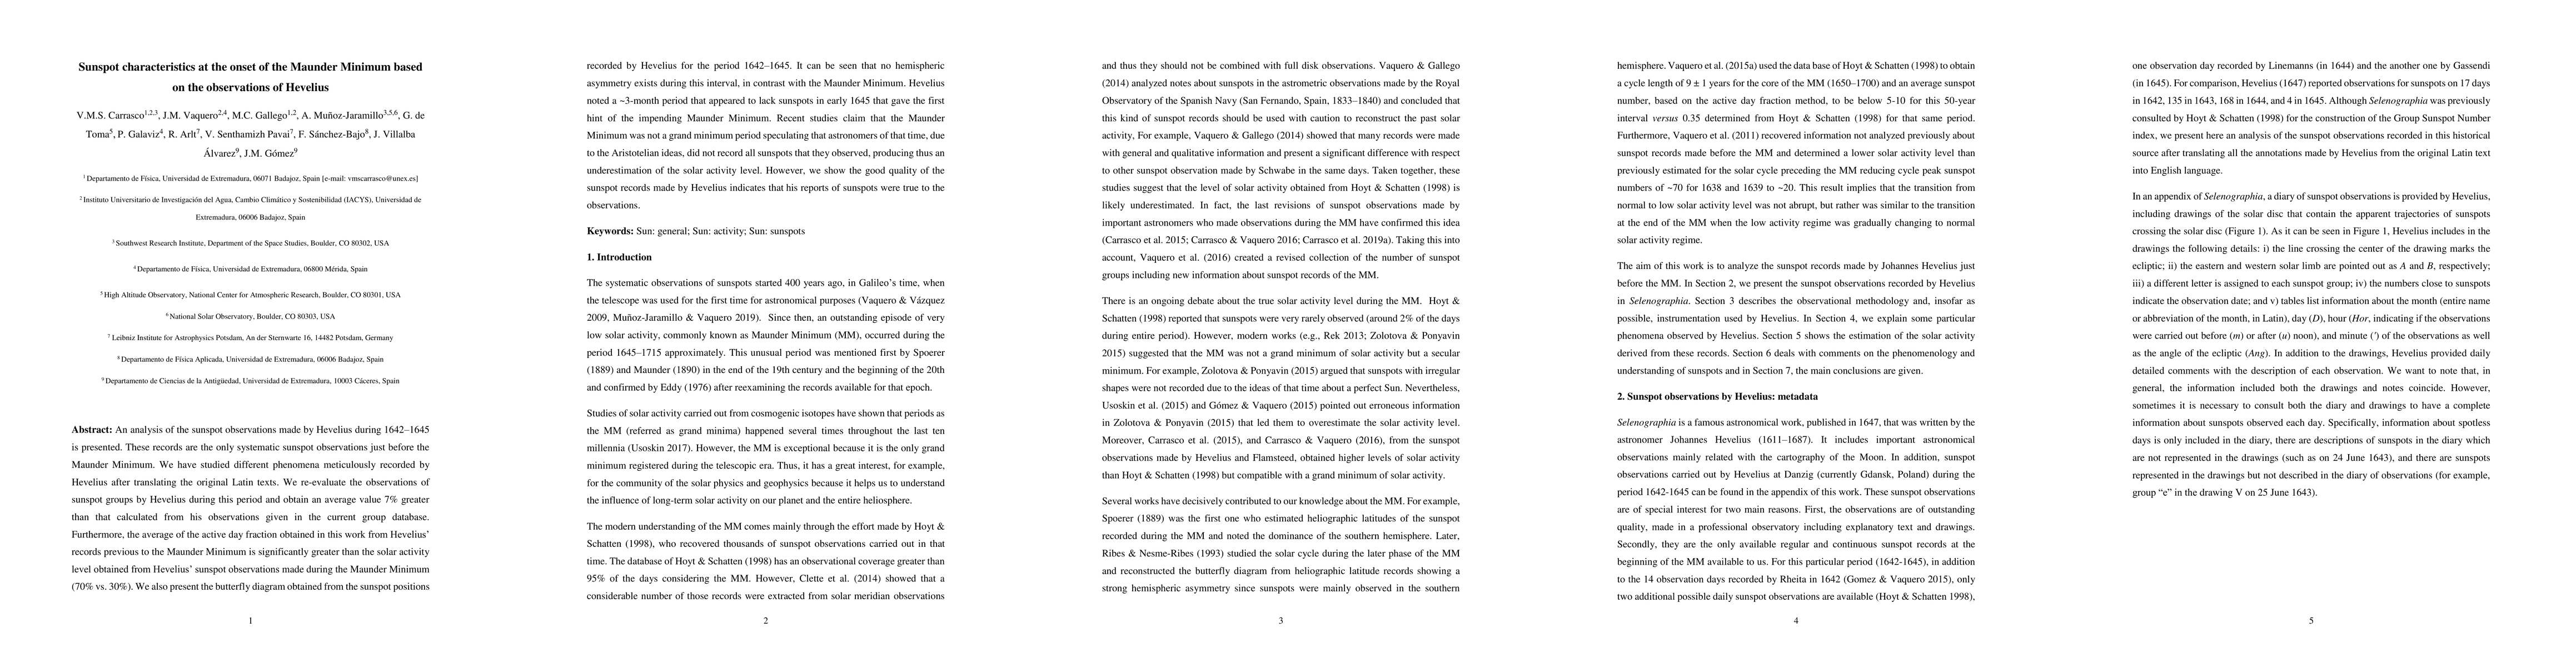
An analysis of the sunspot observations made by Hevelius during 1642-1645 is presented. These records are the only systematic sunspot observations just before the Maunder Minimum. We have studied different phenomena meticulously recorded by Hevelius after translating the original Latin texts. We re-evaluate the observations of sunspot groups by Hevelius during this period and obtain an average value 7% greater than that calculated from his observations given in the current group database. Furthermore, the average of the active day fraction obtained in this work from Hevelius' records previous to the Maunder Minimum is significantly greater than the solar activity level obtained from Hevelius' sunspot observations made during the Maunder Minimum (70% vs. 30%). We also present the butterfly diagram obtained from the sunspot positions recorded by Hevelius for the period 1642-1645. It can be seen that no hemispheric asymmetry exists during this interval, in contrast with the Maunder Minimum. Hevelius noted a ~3-month period that appeared to lack sunspots in early 1645 that gave the first hint of the impending Maunder Minimum. Recent studies claim that the Maunder Minimum was not a grand minimum period speculating that astronomers of that time, due to the Aristotelian ideas, did not record all sunspots that they observed, producing thus an underestimation of the solar activity level. However, we show the good quality of the sunspot records made by Hevelius indicates that his reports of sunspots were true to the observations.
AI Key Findings
Get AI-generated insights about this paper's methodology, results, and significance.
Paper Details
PDF Preview
Key Terms
Citation Network
Current paper (gray), citations (green), references (blue)
Display is limited for performance on very large graphs.
Similar Papers
Found 4 papers| Title | Authors | Year | Actions |
|---|
Comments (0)