Publication
Metrics
AI Quick Summary
This paper investigates the estimation of Super-Massive Black Hole (SMBH) mass by analyzing relativistic effects on X-ray flares from Sagittarius A*. The study proposes that the observed asymmetric light curves are due to relativistic boosting and lensing, providing a method to constrain SMBH mass.
Paper Preview
Abstract
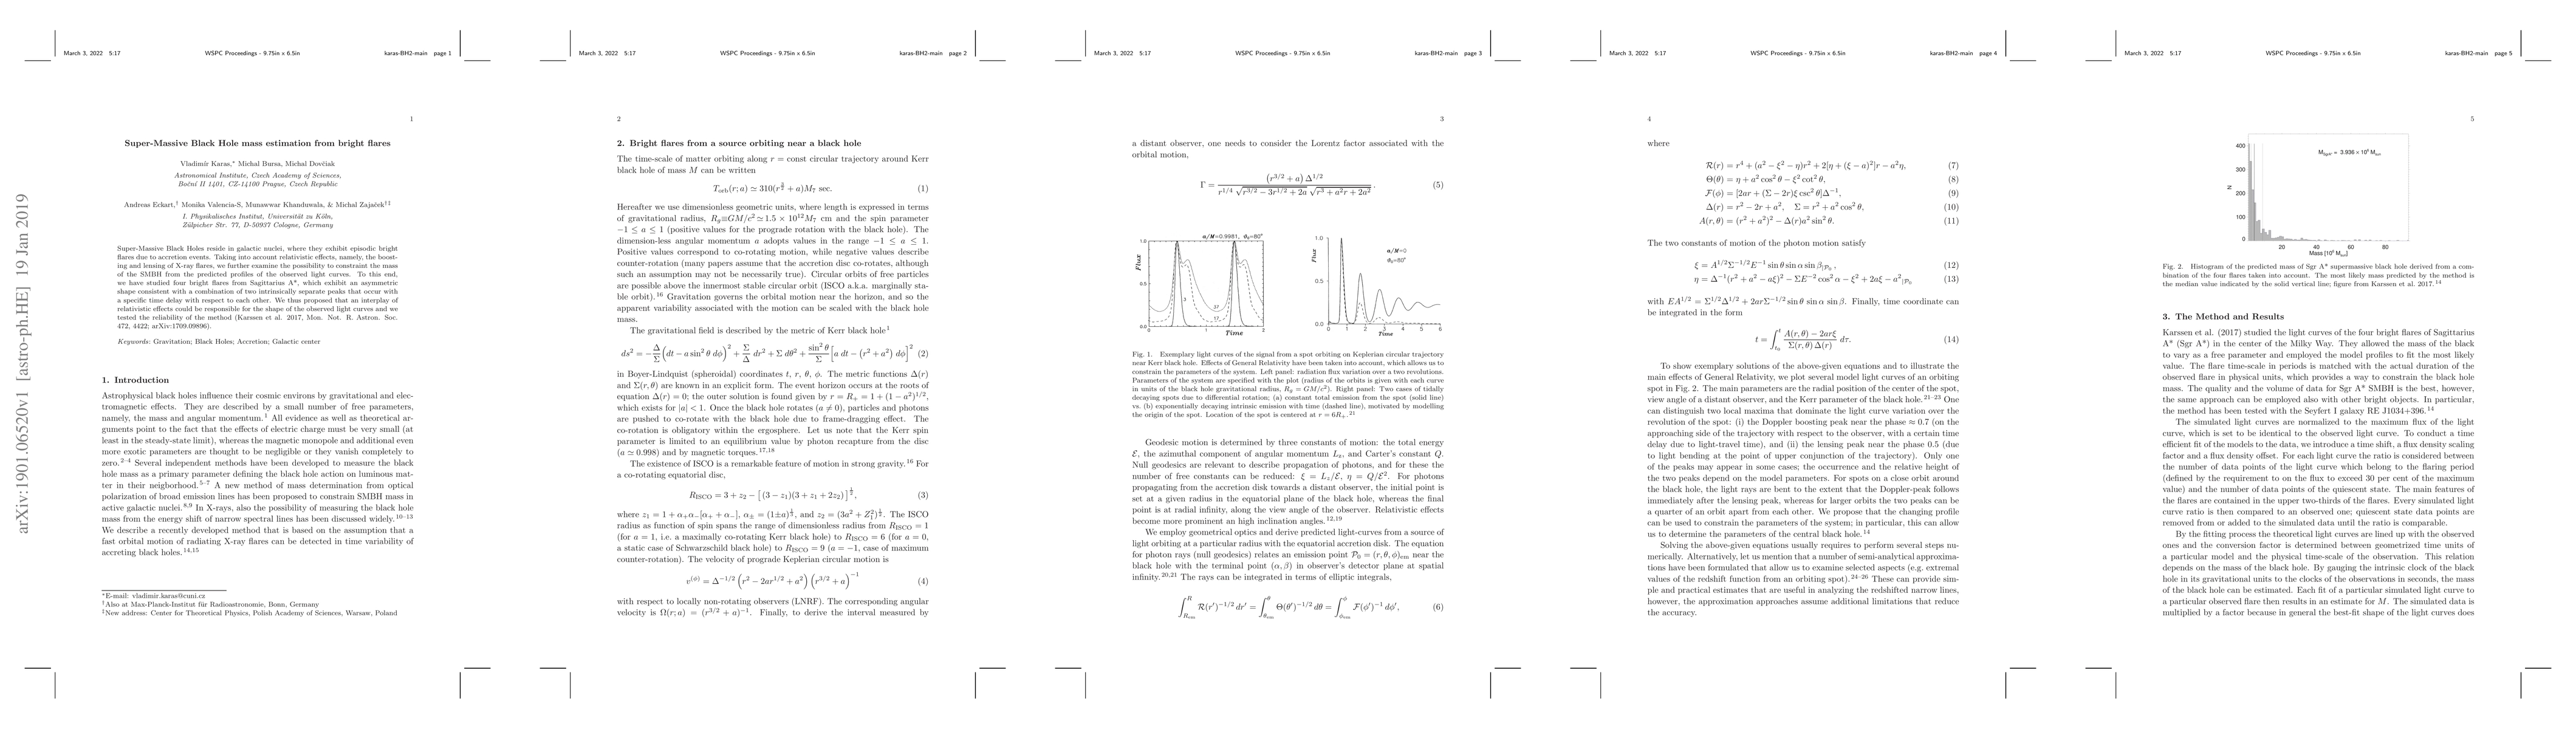
Super-Massive Black Holes reside in galactic nuclei, where they exhibit episodic bright flares due to accretion events. Taking into account relativistic effects, namely, the boosting and lensing of X-ray flares, we further examine the possibility to constraint the mass of the SMBH from the predicted profiles of the observed light curves. To this end, we have studied four bright flares from Sagittarius A*, which exhibit an asymmetric shape consistent with a combination of two intrinsically separate peaks that occur with a specific time delay with respect to each other. We have thus proposed (Karssen et al. 2017, Mon. Not. R. Astron. Soc. 472, 4422) that an interplay of relativistic effects could be responsible for the shape of the observed light curves and we tested the reliability of the method.
AI Key Findings
Get AI-generated insights about this paper's methodology, results, significance, and more — seven facets brought into focus.
Paper Details
Authors
PDF Preview
Key Terms
Related Papers
No references found for this paper.
Discussion 0