The paper investigates design strategies for interactive visualization tools in computational notebooks, analyzing 163 such tools to uncover design implications and trade-offs, including leveraging multimodal data and platform compatibility. It introduces SuperNOVA, an open-source browser for exploring these tools.
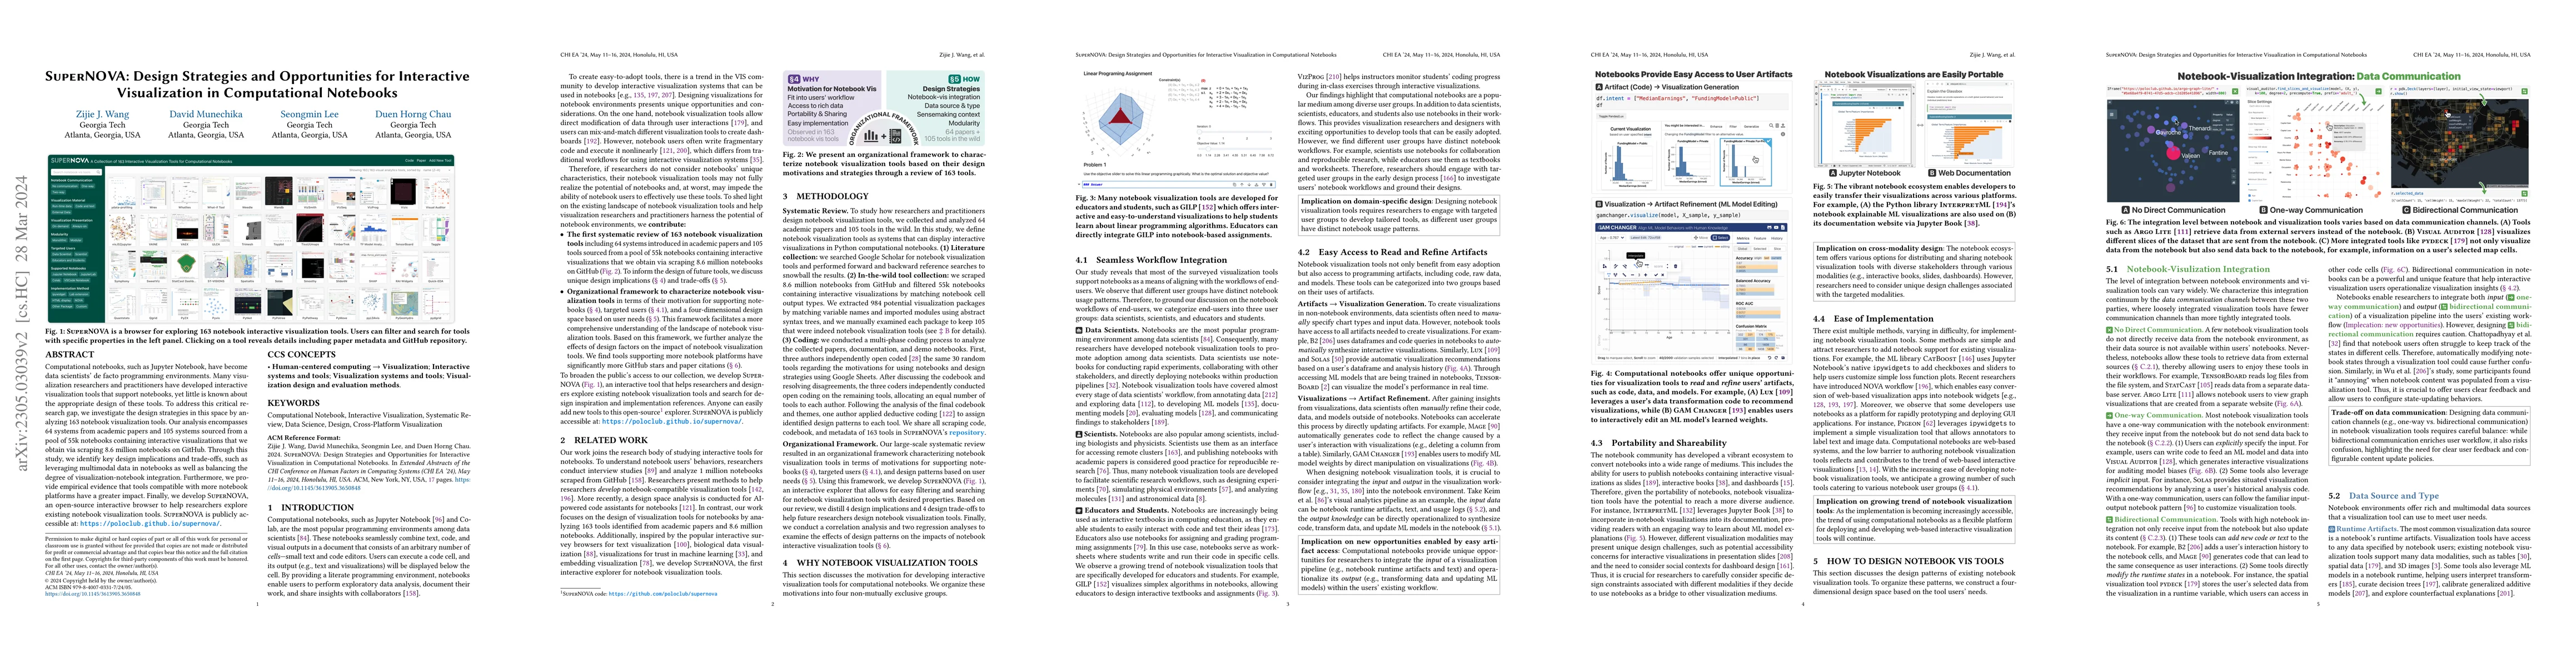
Computational notebooks, such as Jupyter Notebook, have become data scientists' de facto programming environments. Many visualization researchers and practitioners have developed interactive visualization tools that support notebooks, yet little is known about the appropriate design of these tools. To address this critical research gap, we investigate the design strategies in this space by analyzing 163 notebook visualization tools. Our analysis encompasses 64 systems from academic papers and 105 systems sourced from a pool of 55k notebooks containing interactive visualizations that we obtain via scraping 8.6 million notebooks on GitHub. Through this study, we identify key design implications and trade-offs, such as leveraging multimodal data in notebooks as well as balancing the degree of visualization-notebook integration. Furthermore, we provide empirical evidence that tools compatible with more notebook platforms have a greater impact. Finally, we develop SuperNOVA, an open-source interactive browser to help researchers explore existing notebook visualization tools. SuperNOVA is publicly accessible at: https://poloclub.github.io/supernova/.
This graph shows how this paper is connected to other research. The current paper is shown in dark gray, papers that cite it are in green, and papers it references are in blue. You can:
• Hover over any node to see the paper title
• Click a node to view that paper's details
• Drag nodes to rearrange the graph
• Use the zoom controls (bottom right) to zoom in/out
Title | Authors | Year | Actions |
---|---|---|---|
Xavier: Toward Better Coding Assistance in Authoring Tabular Data Wrangling Scripts
|
Yunfan Zhou, Xiwen Cai, Qiming Shi, Yanwei Huang, Haotian Li, Huamin Qu, Di Weng, Yingcai Wu
|
2025
|
View Paper |
Anywidget: Reusable Widgets for Interactive Analysis and Visualization in Computational Notebooks
|
Trevor Manz, Nezar Abdennur, Nils Gehlenborg
|
2024
|
View Paper |
Visualization Artifacts are Boundary Objects
|
Jasmine T. Otto, Scott Davidoff
|
2024
|
View Paper |
Contextualized Data-Wrangling Code Generation in Computational Notebooks
|
Junjie Huang, Daya Guo, Chenglong Wang, Jiazhen Gu, Shuai Lu, J. Inala, Cong Yan, Jianfeng Gao, Nan Duan, Michael R. Lyu
|
2024
|
View Paper |
Any notebook served: authoring and sharing reusable interactive widgets
|
Trevor Manz, Nils Gehlenborg, Nezar Abdennur
|
2024
|
View Paper |
Visualization for Trust in Machine Learning Revisited: The State of the Field in 2023
|
Angelos Chatzimparmpas, Kostiantyn Kucher, A. Kerren
|
2024
|
View Paper |
WizMap: Scalable Interactive Visualization for Exploring Large Machine Learning Embeddings
|
Zijie J. Wang, Fred Hohman, Duen Horng Chau
|
2023
|
View Paper |
Title | Authors | Year | Actions |
---|---|---|---|
Farsight: Fostering Responsible AI Awareness During AI Application Prototyping
|
Zijie J. Wang, Chinmay Kulkarni, Lauren Wilcox, Michael Terry, Michael Madaio
|
2024
|
View Paper |
Visualization for Trust in Machine Learning Revisited: The State of the Field in 2023
|
Angelos Chatzimparmpas, Kostiantyn Kucher, A. Kerren
|
2024
|
View Paper |
Dead or Alive: Continuous Data Profiling for Interactive Data Science
|
Will Epperson, Vaishnavi Gorantla, Dominik Moritz, Adam Perer
|
2023
|
View Paper |
InkSight: Leveraging Sketch Interaction for Documenting Chart Findings in Computational Notebooks
|
Yanna Lin, Haotian Li, Leni Yang, Aoyu Wu, Huamin Qu
|
2023
|
View Paper |
VA + Embeddings STAR: A State‐of‐the‐Art Report on the Use of Embeddings in Visual Analytics
|
Z. Huang, D. Witschard, Kostiantyn Kucher, A. Kerren
|
2023
|
View Paper |
Weedle: Composable Dashboard for Data-Centric NLP in Computational Notebooks
|
Nahyun Kwon, H. Kim, Sajjadur Rahman, Dan Zhang, Estevam Hruschka
|
2023
|
View Paper |
Slide4N: Creating Presentation Slides from Computational Notebooks with Human-AI Collaboration
|
Fengjie Wang, Xuye Liu, Oujing Liu, Ali Neshati, Tengfei Ma, Min Zhu, J. Zhao
|
2023
|
View Paper |
VizProg: Identifying Misunderstandings By Visualizing Students’ Coding Progress
|
Ashley Ge Zhang, Yuanchun Chen, Steve Oney
|
2023
|
View Paper |
Designing Responsible AI: Adaptations of UX Practice to Meet Responsible AI Challenges
|
Qiaosi Wang, Michael A. Madaio, Shaun K. Kane, Shivani Kapania, Michael Terry, Lauren Wilcox
|
2023
|
View Paper |
Notable: On-the-fly Assistant for Data Storytelling in Computational Notebooks
|
Haotian Li, Lu Ying, Haidong Zhang, Yingcai Wu, Huamin Qu, Yun Wang
|
2023
|
View Paper |
Model Sketching: Centering Concepts in Early-Stage Machine Learning Model Design
|
Michelle S. Lam, Zixian Ma, Anne Li, Izequiel Freitas, Dakuo Wang, J. Landay, Michael S. Bernstein
|
2023
|
View Paper |
Causalvis: Visualizations for Causal Inference
|
G. Guo, Ehud Karavani, A. Endert, Bum Chul Kwon
|
2023
|
View Paper |
On the Design of AI-powered Code Assistants for Notebooks
|
A. Mcnutt, Chenglong Wang, R. Deline, S. Drucker
|
2023
|
View Paper |
MEGAnno: Exploratory Labeling for NLP in Computational Notebooks
|
Dan Zhang, H. Kim, Rafael Li Chen, Eser Kandogan, Estevam Hruschka
|
2023
|
View Paper |
GILP: An Interactive Tool for Visualizing the Simplex Algorithm
|
Henry W Robbins, Samuel C. Gutekunst, Frans Schalekamp, D. Shmoys, David P. Williamson
|
2022
|
View Paper |
Interactive Visualization for Data Science Scripts
|
Rebecca Faust, C. Scheidegger, Katherine M. Isaacs, W. Bernstein, Michael Sharp, Chris North
|
2022
|
View Paper |
TimberTrek: Exploring and Curating Sparse Decision Trees with Interactive Visualization
|
Zijie J. Wang, Chudi Zhong, Rui Xin, Takuya Takagi, Zhi Chen, Duen Horng Chau, C. Rudin, M. Seltzer
|
2022
|
View Paper |
Calibrate: Interactive Analysis of Probabilistic Model Output
|
Peter Xenopoulos, João Rulff, L. G. Nonato, Brian Barr, Cláudio T. Silva
|
2022
|
View Paper |
Firefly: A Browser-based Interactive 3D Data Visualization Tool for Millions of Data Points
|
Alex Gurvich, A. Geller
|
2022
|
View Paper |
Gwaihir: Jupyter Notebook graphical user interface for Bragg coherent diffraction imaging
|
D. Simonne, J. Carnis, C. Atlan, C. Chatelier, V. Favre-Nicolin, M. Dupraz, S. Leake, E. Zatterin, A. Resta, A. Coati, M. Richard
|
2022
|
View Paper |
Interpretability, Then What? Editing Machine Learning Models to Reflect Human Knowledge and Values
|
Zijie J. Wang, Alex Kale, Harsha Nori, P. Stella, M. Nunnally, Mihaela Vorvoreanu, J. W. Vaughan, R. Caruana
|
2022
|
View Paper |
Visual Auditor: Interactive Visualization for Detection and Summarization of Model Biases
|
David Munechika, Zijie J. Wang, Jack Reidy, Josh Rubin, Krishna Gade, K. Kenthapadi, Duen Horng Chau
|
2022
|
View Paper |
Plotly-Resampler: Effective Visual Analytics for Large Time Series
|
Jonas Van Der Donckt, Jeroen Van Der Donckt, Emiel Deprost, S. V. Hoecke
|
2022
|
View Paper |
The NOMAD Artificial-Intelligence Toolkit: turning materials-science data into knowledge and understanding
|
Luigi Sbailò, Ádám Fekete, L. Ghiringhelli, Matthias Scheffler
|
2022
|
View Paper |
Exploring How Machine Learning Practitioners (Try To) Use Fairness Toolkits
|
Wesley Hanwen Deng, Manish Nagireddy, M. S. Lee, Jatinder Singh, Zhiwei Steven Wu, Kenneth Holstein, Haiyi Zhu
|
2022
|
View Paper |
Design Concerns for Integrated Scripting and Interactive Visualization in Notebook Environments
|
Connor Scully-Allison, Ian G. Lumsden, Katy Williams, Jesse Bartels, M. Taufer, S. Brink, A. Bhatele, O. Pearce, Katherine E. Isaacs
|
2022
|
View Paper |
NOVA: A Practical Method for Creating Notebook-Ready Visual Analytics
|
Zijie J. Wang, David Munechika, Seongmin Lee, Duen Horng Chau
|
2022
|
View Paper |
Data+Shift: Supporting visual investigation of data distribution shifts by data scientists
|
João Palmeiro, Beatriz Malveiro, Rita Costa, David Polido, Ricardo Moreira, P. Bizarro
|
2022
|
View Paper |
Aspirations and Practice of ML Model Documentation: Moving the Needle with Nudging and Traceability
|
Avinash Bhat, Austin Coursey, Grace Hu, Sixian Li, Nadia Nahar, Shurui Zhou, Christian Kastner, Jin L. C. Guo
|
2022
|
View Paper |
BERTopic: Neural topic modeling with a class-based TF-IDF procedure
|
M. Grootendorst
|
2022
|
View Paper |
Interactive Visualization of Protein RINs using NetworKit in the Cloud
|
Eugenio Angriman, Fabian Brandt-Tumescheit, Leon Franke, Alexander van der Grinten, Henning Meyerhenke
|
2022
|
View Paper |
StickyLand: Breaking the Linear Presentation of Computational Notebooks
|
Zijie J. Wang, Katie Dai, W. K. Edwards
|
2022
|
View Paper |
Symphony: Composing Interactive Interfaces for Machine Learning
|
Alex Bauerle, Ángel Alexander Cabrera, Fred Hohman, Megan Maher Welsh, David Koski, Xavier Suau, Titus Barik, Dominik Moritz
|
2022
|
View Paper |
GitHub
|
Sufyan bin Uzayr
|
2022
|
View Paper |
Emblaze: Illuminating Machine Learning Representations through Interactive Comparison of Embedding Spaces
|
Venkatesh Sivaraman, Yiwei Wu, Adam Perer
|
2022
|
View Paper |
TissUUmaps 3: Improvements in interactive visualization, exploration, and quality assessment of large-scale spatial omics data
|
Nicolas Pielawski, Axel Andersson, C. Avenel, A. Behanova, Eduard Chelebian, Anna H. Klemm, F. Nysjö, L. Solorzano, C. Wählby
|
2022
|
View Paper |
In Defence of Visual Analytics Systems: Replies to Critics
|
Aoyu Wu, Dazhen Deng, Furui Cheng, Yingcai Wu, Shixia Liu, Huamin Qu
|
2022
|
View Paper |
EDAssistant: Supporting Exploratory Data Analysis in Computational Notebooks with In Situ Code Search and Recommendation
|
Xingjun Li, Yizhi Zhang, Justin Leung, Chengnian Sun, Jian Zhao
|
2021
|
View Paper |
Jigsaw: Large Language Models meet Program Synthesis
|
Naman Jain, Skanda Vaidyanath, Arun Shankar Iyer, Nagarajan Natarajan, Suresh Parthasarathy, S. Rajamani, Rahul Sharma
|
2021
|
View Paper |
Notebook‐as‐a‐VRE (NaaVRE): From private notebooks to a collaborative cloud virtual research environment
|
Zhiming Zhao, Spiros Koulouzis, Riccardo Bianchi, Siamak Farshidi, Zeshun Shi, Ruyue Xin, Yuandou Wang, N. Li, Yifang Shi, J. Timmermans, Werner Kissling
|
2021
|
View Paper |
VizSmith: Automated Visualization Synthesis by Mining Data-Science Notebooks
|
Rohan Bavishi, Shadaj Laddad, H. Yoshida, M. Prasad, Koushik Sen
|
2021
|
View Paper |
HyRiver: Hydroclimate Data Retriever
|
T. Chegini, Hong‐Yi Li, L. Leung
|
2021
|
View Paper |
Visionary Caption: Improving the Accessibility of Presentation Slides Through Highlighting Visualization
|
Carmen Yip, Jie Mi Chong, sin yee kwek, Yong Wang, Kotaro Hara
|
2021
|
View Paper |
VAINE: Visualization and AI for Natural Experiments
|
G. Guo, M. Glenski, Z. Shaw, Emily Saldanha, A. Endert, Svitlana Volkova, Dustin L. Arendt
|
2021
|
View Paper |
Attribute-based Explanation of Non-Linear Embeddings of High-Dimensional Data
|
Jan-Tobias Sohns, M. Schmitt, F. Jirasek, H. Hasse, H. Leitte
|
2021
|
View Paper |
PI2: End-to-end Interactive Visualization Interface Generation from Queries
|
Yiru Chen, Eugene Wu
|
2021
|
View Paper |
Interactive Dimensionality Reduction for Comparative Analysis
|
Takanori Fujiwara, Xinhai Wei, Jian Zhao, K. Ma
|
2021
|
View Paper |
ST_VISIONS: A Python Library for Interactive Visualization of Spatio-temporal Data
|
Andreas Tritsarolis, C. Doulkeridis, N. Pelekis, Y. Theodoridis
|
2021
|
View Paper |
Fork It: Supporting Stateful Alternatives in Computational Notebooks
|
Nathaniel Weinman, S. Drucker, Titus Barik, R. Deline
|
2021
|
View Paper |
Lux: Always-on Visualization Recommendations for Exploratory Dataframe Workflows
|
D. Lee, Dixin Tang, Kunal Agarwal, Thyne Boonmark, Caitlyn Chen, J. Kang, U. Mukhopadhyay, Jerry Song, Micah Yong, Marti A. Hearst, Aditya G. Parameswaran
|
2021
|
View Paper |
DataPrep.EDA: Task-Centric Exploratory Data Analysis for Statistical Modeling in Python
|
Jinglin Peng, Weiyuan Wu, Brandon Lockhart, S. Bian, J. Yan, Linghao Xu, Zhixuan Chi, Jeffrey M. Rzeszotarski, Jiannan Wang
|
2021
|
View Paper |
Towards Modeling Student Engagement with Interactive Computing Textbooks: An Empirical Study
|
IV DavidH.Smith, Qiang Hao, C. Hundhausen, Filip Jagodzinski, Josh Myers-Dean, Kira Jaeger
|
2021
|
View Paper |
Interactive Data Visualization in Jupyter Notebooks
|
Jorge Piazentin Ono, J. Freire, Cláudio T. Silva, J. Comba, K. Gaither
|
2021
|
View Paper |
geopandas/geopandas: v0.10.2
|
Kelsey Jordahl, Joris Van den Bossche, Martin Fleischmann, James McBride, Jacob Wasserman, Adrian Garcia Badaracco, Jeffrey Gerard, Alan D. Snow, Jeff Tratner, Matthew Perry, Carson Farmer, Geir Arne Hjelle, Micah Cochran, Sean Gillies, Lucas Culbertson, Matt Bartos, Brendan Ward, Giacomo Caria, Mike Taves, Nick Eubank, sangarshanan, John Flavin, Matt Richards, Sergio J. Rey, maxalbert, Aleksey Bilogur, Christopher Ren, Dani Arribas-Bel, Daniel Mesejo-León, Leah Wasser
|
2021
|
View Paper |
B2: Bridging Code and Interactive Visualization in Computational Notebooks
|
Yifan Wu, J. Hellerstein, Arvind Satyanarayan
|
2020
|
View Paper |
mage: Fluid Moves Between Code and Graphical Work in Computational Notebooks
|
Mary Beth Kery, Donghao Ren, Fred Hohman, Dominik Moritz, Kanit Wongsuphasawat, Kayur Patel
|
2020
|
View Paper |
Going Beyond T-SNE: Exposing whatlies in Text Embeddings
|
Vincent D. Warmerdam, Thomas Kober, Rachael Tatman
|
2020
|
View Paper |
Argo Lite: Open-Source Interactive Graph Exploration and Visualization in Browsers
|
Siwei Li, Zhiyan Zhou, Anish Upadhayay, Omar Shaikh, Scott Freitas, Haekyu Park, Zijie J. Wang, Susanta Routray, Matthew Hull, Duen Horng Chau
|
2020
|
View Paper |
NL4DV: A Toolkit for Generating Analytic Specifications for Data Visualization from Natural Language Queries
|
Arpit Narechania, Arjun Srinivasan, J. Stasko
|
2020
|
View Paper |
The Language Interpretability Tool: Extensible, Interactive Visualizations and Analysis for NLP Models
|
Ian Tenney, James Wexler, Jasmijn Bastings, Tolga Bolukbasi, Andy Coenen, Sebastian Gehrmann, Ellen Jiang, Mahima Pushkarna, Carey Radebaugh, Emily Reif, Ann Yuan
|
2020
|
View Paper |
InsightSoftwareConsortium/itkwidgets: itkwidgets 0.32.0
|
Matt McCormick, A. Kaszynski, M. Musy, Alex Remedios, B. Sullivan, Dave Chen, Kevin Mader, D. Ushizima, D. Haberthür, Erik Sundell, Florian Jug, Genevieve Buckley, Hadrien Mary, J. Pambrun, J. Fillion-Robin, Ramraj Chandradevan
|
2020
|
View Paper |
The Design Space of Computational Notebooks: An Analysis of 60 Systems in Academia and Industry
|
Sam Lau, Ian Drosos, Julia M. Markel, Philip J. Guo
|
2020
|
View Paper |
Where Responsible AI meets Reality
|
B. Rakova, Jingying Yang, H. Cramer, Rumman Chowdhury
|
2020
|
View Paper |
Principles to Practices for Responsible AI: Closing the Gap
|
Daniel S. Schiff, B. Rakova, A. Ayesh, Anat Fanti, M. Lennon
|
2020
|
View Paper |
Network visualizations with Pyvis and VisJS
|
Giancarlo Perrone, J. Unpingco, Haw-minn Lu
|
2020
|
View Paper |
Fairlearn: A toolkit for assessing and improving fairness in AI
|
Sarah Bird, Miroslav Dudík, R. Edgar, Brandon Horn, Roman Lutz, Vanessa Milan, M. Sameki, Hanna M. Wallach, Kathleen Walker
|
2020
|
View Paper |
PipelineProfiler: A Visual Analytics Tool for the Exploration of AutoML Pipelines
|
Jorge Piazentin Ono, Sonia Castelo, Roque López, E. Bertini, J. Freire, Cláudio T. Silva
|
2020
|
View Paper |
What's Wrong with Computational Notebooks? Pain Points, Needs, and Design Opportunities
|
Souti Chattopadhyay, I. Prasad, Austin Z. Henley, A. Sarma, Titus Barik
|
2020
|
View Paper |
Wrex: A Unified Programming-by-Example Interaction for Synthesizing Readable Code for Data Scientists
|
Ian Drosos, Titus Barik, Philip J. Guo, R. Deline, Sumit Gulwani
|
2020
|
View Paper |
t|ket⟩: a retargetable compiler for NISQ devices
|
Seyon Sivarajah, Silas Dilkes, Alexander Cowtan, Will Simmons, A. Edgington, Ross Duncan
|
2020
|
View Paper |
Bacatá: Notebooks for DSLs, Almost for Free
|
M. V. Merino, J. Vinju, T. Storm
|
2020
|
View Paper |
How do Data Science Workers Collaborate? Roles, Workflows, and Tools
|
Amy X. Zhang, Michael J. Muller, Dakuo Wang
|
2020
|
View Paper |
InterpretML: A Unified Framework for Machine Learning Interpretability
|
Harsha Nori, Samuel Jenkins, Paul Koch, R. Caruana
|
2019
|
View Paper |
VizSeq: a visual analysis toolkit for text generation tasks
|
Changhan Wang, Anirudh Jain, Danlu Chen, Jiatao Gu
|
2019
|
View Paper |
The What-If Tool: Interactive Probing of Machine Learning Models
|
James Wexler, Mahima Pushkarna, Tolga Bolukbasi, M. Wattenberg, F. Viégas, Jimbo Wilson
|
2019
|
View Paper |
Errudite: Scalable, Reproducible, and Testable Error Analysis
|
Tongshuang Sherry Wu, Marco Tulio Ribeiro, Jeffrey Heer, Daniel S. Weld
|
2019
|
View Paper |
A Multiscale Visualization of Attention in the Transformer Model
|
Jesse Vig
|
2019
|
View Paper |
Visualizing a Moving Target: A Design Study on Task Parallel Programs in the Presence of Evolving Data and Concerns
|
Katy Williams, Alex Bigelow, Kate Isaacs
|
2019
|
View Paper |
PyZX: Large Scale Automated Diagrammatic Reasoning
|
A. Kissinger, J. V. D. Wetering
|
2019
|
View Paper |
What Do We Talk About When We Talk About Dashboards?
|
Alper Sarıkaya, M. Correll, L. Bartram, Melanie Tory, Danyel Fisher
|
2019
|
View Paper |
Altair: Interactive Statistical Visualizations for Python
|
J. Vanderplas, B. Granger, Jeffrey Heer, Dominik Moritz, Kanit Wongsuphasawat, Arvind Satyanarayan, Eitan Lees, I. Timofeev, Ben Welsh, Scott Sievert
|
2018
|
View Paper |
Lightkurve: Kepler and TESS time series analysis in Python
|
J. V. M. Cardoso, C. Hedges, M. Gully-Santiago, Nicholas Saunders, A. Cody, T. Barclay, O. Hall, Sheila Sagear, E. Turtelboom, Johnny Zhang, Andy Tzanidakis, K. Mighell, J. Coughlin, K. Bell, Z. Berta-Thompson, P. Williams, J. Dotson, G. Barentsen
|
2018
|
View Paper |
Aequitas: A Bias and Fairness Audit Toolkit
|
Pedro Saleiro, Benedict Kuester, Abby Stevens, Ari Anisfeld, Loren Hinkson, J. London, R. Ghani
|
2018
|
View Paper |
Vega-Lite: A Grammar of Interactive Graphics
|
Arvind Satyanarayan, Dominik Moritz, Kanit Wongsuphasawat, Jeffrey Heer
|
2018
|
View Paper |
Model Cards for Model Reporting
|
Margaret Mitchell, Simone Wu, Andrew Zaldivar, Parker Barnes, Lucy Vasserman, Ben Hutchinson, Elena Spitzer, Inioluwa Deborah Raji, Timnit Gebru
|
2018
|
View Paper |
JOVIAL: Notebook-based Astronomical Data Analysis in the Cloud
|
Mauricio Araya, Maximiliano Osorio, M. Díaz, C. Ponce, Martín Villanueva, C. Valenzuela, M. Solar
|
2018
|
View Paper |
A User‐based Visual Analytics Workflow for Exploratory Model Analysis
|
Dylan Cashman, S. Humayoun, Florian Heimerl, Kendall Park, Subhajit Das, John Thompson, B. Saket, Abigail Mosca, J. Stasko, A. Endert, Michael Gleicher, Remco Chang
|
2018
|
View Paper |
Autodesk
|
U. Sendler
|
2018
|
View Paper |
The Story in the Notebook: Exploratory Data Science using a Literate Programming Tool
|
Mary Beth Kery, Marissa Radensky, Mahima Arya, Bonnie E. John, B. Myers
|
2018
|
View Paper |
Exploration and Explanation in Computational Notebooks
|
Adam Rule, A. Tabard, James Hollan
|
2018
|
View Paper |
NGLview–interactive molecular graphics for Jupyter notebooks
|
Hai Nguyen, D. Case, Alexander S. Rose
|
2018
|
View Paper |
Cyberhubs: Virtual Research Environments for Astronomy
|
F. Herwig, R. Andrassy, N. Annau, O. Clarkson, Benoit Côté, A. D'Sa, Samuel Jones, B. Moa, J. O'Connell, D. Porter, C. Ritter, P. Woodward
|
2018
|
View Paper |
Open3D: A Modern Library for 3D Data Processing
|
Qian-Yi Zhou, Jaesik Park, V. Koltun
|
2018
|
View Paper |
Taggle: Combining overview and details in tabular data visualizations
|
Katarína Furmanová, S. Gratzl, Holger Stitz, T. Zichner, Miroslava Jaresová, A. Lex, M. Streit
|
2017
|
View Paper |
LightGBM: A Highly Efficient Gradient Boosting Decision Tree
|
Guolin Ke, Qi Meng, Thomas Finley, Taifeng Wang, Wei Chen, Weidong Ma, Qiwei Ye, Tie-Yan Liu
|
2017
|
View Paper |
Beagle: Automated Extraction and Interpretation of Visualizations from the Web
|
L. Battle, Peitong Duan, Zachery Miranda, Dana Mukusheva, Remco Chang, M. Stonebraker
|
2017
|
View Paper |
BioVis Explorer: A visual guide for biological data visualization techniques
|
A. Kerren, Kostiantyn Kucher, Yuan-Fang Li, F. Schreiber
|
2017
|
View Paper |
Clustergrammer, a web-based heatmap visualization and analysis tool for high-dimensional biological data
|
Nicolas F. Fernandez, Gregory W. Gundersen, Adeeb H. Rahman, M. Grimes, Klarisa Rikova, P. Hornbeck, Avi Ma’ayan
|
2017
|
View Paper |
CatBoost: unbiased boosting with categorical features
|
L. Ostroumova, Gleb Gusev, A. Vorobev, Anna Veronika Dorogush, Andrey Gulin
|
2017
|
View Paper |
A Unified Approach to Interpreting Model Predictions
|
Scott M. Lundberg, Su-In Lee
|
2017
|
View Paper |
Vizic: A Jupyter-based interactive visualization tool for astronomical catalogs
|
Yu Wang, M. Kind, R. Brunner
|
2017
|
View Paper |
Interactive (statistical) visualisation and exploration of a billion objects with vaex
|
M. Breddels
|
2016
|
View Paper |
StatCast Dashboard: Exploration of Spatiotemporal Baseball Data
|
Marcos Lage, Jorge Piazentin Ono, D. Cervone, Justin Chiang, C. Dietrich, Cláudio T. Silva
|
2016
|
View Paper |
TensorFlow: A system for large-scale machine learning
|
Martín Abadi, P. Barham, Jianmin Chen, Z. Chen, Andy Davis, J. Dean, M. Devin, Sanjay Ghemawat, G. Irving, M. Isard, M. Kudlur, J. Levenberg, R. Monga, Sherry Moore, D. Murray, Benoit Steiner, P. Tucker, Vijay Vasudevan, Pete Warden, M. Wicke, Yuan Yu, Xiaoqiang Zhang
|
2016
|
View Paper |
What May Visualization Processes Optimize?
|
Min Chen, Amos Golan
|
2015
|
View Paper |
Text visualization techniques: Taxonomy, visual survey, and community insights
|
Kostiantyn Kucher, A. Kerren
|
2015
|
View Paper |
LDAvis: A method for visualizing and interpreting topics
|
Carson Sievert, Kenneth E. Shirley
|
2014
|
View Paper |
Machine learning for neuroimaging with scikit-learn
|
Alexandre Abraham, Fabian Pedregosa, Michael Eickenberg, Philippe Gervais, A. Mueller, Jean Kossaifi, Alexandre Gramfort, B. Thirion, G. Varoquaux
|
2014
|
View Paper |
Design Study Methodology: Reflections from the Trenches and the Stacks
|
M. Sedlmair, Miriah D. Meyer, T. Munzner
|
2012
|
View Paper |
D³ Data-Driven Documents
|
M. Bostock, Vadim Ogievetsky, Jeffrey Heer
|
2011
|
View Paper |
Mental Models, Visual Reasoning and Interaction in Information Visualization: A Top-down Perspective
|
Zhicheng Liu, J. Stasko
|
2010
|
View Paper |
Mayavi: 3D Visualization of Scientific Data
|
P. Ramachandran, G. Varoquaux
|
2010
|
View Paper |
Visual Analytics: Definition, Process, and Challenges
|
D. Keim, G. Andrienko, Jean-Daniel Fekete, C. Görg, J. Kohlhammer, G. Melançon
|
2008
|
View Paper |
Matplotlib: A 2D Graphics Environment
|
John D. Hunter
|
2007
|
View Paper |
An introduction to qualitative research
|
Ian Alexander
|
2000
|
View Paper |
Agile Software Process and its experience
|
M. Aoyama
|
1998
|
View Paper |
The application visualization system: a computational environment for scientific visualization
|
C. Upson, T. Faulhaber, D. Kamins, D. Laidlaw, David Schlegel, Jefrey Vroom, Robert F. Gurwitz, A. V. Dam
|
1989
|
View Paper |
Direct Manipulation Interfaces
|
E. Hutchins, James Hollan, D. Norman
|
1985
|
View Paper |
MLProvLab: Provenance Management for Data Science Notebooks
|
Dominik Kerzel, B. König-Ries, Sheeba Samuel
|
2023
|
View Paper |
Visualize Python code execution (line-by-line) in Jupyter Notebook cells
|
2023
|
||
Aspirations and Practice of Model Documentation: Moving the Needle with Nudging and Traceability
|
Avinash Bhat, Austin Coursey, Grace Hu, Sixian Li, Nadia Nahar, Shurui Zhou, Christian Kästner, Jin L. C. Guo
|
2022
|
View Paper |
State of Machine Learning and Data Science
|
2022
|
||
Cytoscape/cytoscape.js. Zenodo, 2022
|
2022
|
||
Leveraging Analysis History for Improved In Situ Visualization Recommendation
|
2022
|
||
. Ipyvizzu: Build Animated Charts in Jupyter Notebook and Similar EnvironmentswithaSimplePythonSyntax
|
2022
|
||
AutoProfiler: Automatically profile dataframes in the Jupyter sidebar
|
2022
|
||
Perspective: Interactive analytics and data visualization component, 2022
|
2022
|
||
. PyPathway: A Python Package for Pathway Visualization
|
2022
|
||
Module for embedding igv.js in an IPython notebook, 2022
|
2022
|
||
Interactive Plot Manipulation using Natural Language
|
Yihan Wang, Yutong Shao, Ndapandula Nakashole
|
2021
|
View Paper |
Brax: A differentiable physics engine
|
2021
|
||
Linguistics: Human Language Technologies: Demonstrations
|
2021
|
||
NVDashboard: A JupyterLab extension for displaying dashboards of GPU usage
|
2021
|
||
Mols2grid - Interactive molecule viewer for 2D structures, 2021
|
2021
|
||
Massively parallel rigidbody physics simulation on accelerator hardware
|
2021
|
||
Data-Purifier: A Python library for Automated Exploratory Data Analysis
|
2021
|
||
Panel: A High-Level App and Dashboarding Solution for Python
|
2021
|
||
Weights&Biases:AToolforVisualizingandTracking Your Machine Learning Experiments
|
2021
|
||
Exploring movement data in notebook environments
|
A. Graser, Melitta Dragaschnig
|
2020
|
View Paper |
PyCaret: An open-source, low-code machine learning library in Python
|
2020
|
||
Jupyter Book
|
2020
|
||
Spatial Data Science for Sustainable Development
|
2020
|
||
Executable Books Community
|
2020
|
||
Python-gatenlp: Python text processing, pattern matching, and NLP framework
|
2020
|
||
Fiftyone: Building high-quality datasets and computer vision models
|
2020
|
||
SweetViz: In-depth EDA in two lines of code
|
2020
|
||
Automatically Visualize any dataset, any size with a single line of code
|
2020
|
||
HiPlot makes understanding high dimensional data easy
|
2020
|
||
Dash: Data Apps & Dashboards for Python
|
2020
|
||
JupyterPiDAQ: Interactive Analog Data Acquisition and Analysis within Jupyter Notebooks Using GUI Tools
|
2020
|
||
Quick-EDA: Simple & Easy-to-use python modules to perform Quick Exploratory Data Analysis for any structured dataset, 2020
|
2020
|
||
Quantstats:PortfolioAnalyticsforQuants,WritteninPython
|
2019
|
||
Bamboolib: GUI for Pandas DataFrames
|
2019
|
||
Ax: Adaptive Experimentation Platform
|
2019
|
||
Pandas-profiling: Exploratory data analysis
|
2019
|
||
Itables: Pandas DataFrames as Interactive DataTables
|
2019
|
||
Pathpy: An OpenSource python package for the analysis of time series data on networks using higher-order and multi-order graphical models
|
2019
|
||
ApacheBeam:UnifiedProgrammingModelforBatchandStream-ing Data Processing
|
2019
|
||
Czml3: Python 3 library to write CZML
|
2019
|
||
Hciplot: Library for visualizing high-contrast imaging multidimensional datacubes on JupyterLab, 2019
|
2019
|
||
Pypotree: Potree for jupyter notebooks and colab, 2019
|
2019
|
||
Ipydatagrid: Fast Datagrid Widget for the Jupyter Notebook and JupyterLab
|
2019
|
||
Unified programming model for Batch and Streaming data processing. The Apache Software Foundation
|
2019
|
||
Nengo : A Python library for creating and simulating large - scale brain models
|
2019
|
||
Kepler.Gl: A Powerful Open Source Geospatial Analysis Tool for Large-Scale Data Sets
|
2019
|
||
Kaleidoscope: Visualizations for Quantum Computing
|
2019
|
||
Folium: Python Data. Leaflet.js Maps
|
2019
|
||
Interactive network visualization in Jupyter notebooks: visJS2jupyter
|
S. Rosenthal, Julia Len, M. Webster, Aaron Gary, A. Birmingham, K. Fisch
|
2018
|
View Paper |
The Interactive Visualization Gap in Initial Exploratory Data Analysis
|
A. Batch, N. Elmqvist
|
2018
|
View Paper |
PyMove: Python library to simplify queries and visualization of trajectories and other spatial-temporal data
|
2018
|
||
Pandas-Bokeh: Bokeh Plotting Backend for Pandas and GeoPandas
|
2018
|
||
Intake: A general interface for loading data
|
2018
|
||
Ipyannotate: Jupyter Widget for Data Annotation
|
2018
|
||
Pigeon: Quickly annotate data on Jupyter
|
2017
|
||
Qgrid:AnInteractiveGridforSorting,Filtering,andEditing DataFrames in Jupyter Notebooks
|
2017
|
||
Ipysheet: Jupyter handsontable integration
|
2017
|
||
Pydgrid: Python Distribution Grid Simulator, 2017
|
2017
|
||
Plotly: Create Interactive Web Graphics via ‘Plotly
|
2017
|
||
Jupyter Notebooks - a publishing format for reproducible computational workflows
|
T. Kluyver, B. Ragan-Kelley, Fernando Pérez, B. Granger, Matthias Bussonnier, J. Frederic, Kyle Kelley, Jessica B. Hamrick, J. Grout, S. Corlay, Paul Ivanov, Damián Avila, Safia Abdalla, Carol Willing, Jupyter Development Team
|
2016
|
View Paper |
Geoviews: Simple, concise geographical visualization in Python. HoloViz
|
2016
|
||
Notebook Molecular Visualization
|
2016
|
||
gl: WebGL2 powered geospatial visualization layers
|
2016
|
||
PyGraphistry: Explore Relationships
|
2016
|
||
Graphistry
|
2016
|
||
Escher: Build, Share, and Embed Visualizations of Metabolic Pathways
|
2016
|
||
: Plotting library for IPython/Jupyter notebooks
|
2016
|
||
Flexx: Write desktop and web apps in pure Python
|
2016
|
||
ELI5: A library for debugging/inspecting machine learning classifiers and explaining their predictions
|
2016
|
||
Chartpy: Easy to use Python API wrapper to plot charts with matplotlib, plotly, bokeh and more
|
2016
|
||
Neo4jupyter: A quick visualization tool for Jupyter and Neo4J
|
2016
|
||
Py2cytoscape: Python utilities for Cytoscape and Cytoscape.js. Cytoscape Consortium
|
2015
|
||
Bokeh Development Team
|
2014
|
||
Jgraph:AnEmbeddablewebGLGraphVisualizationLibrary
|
2013
|
||
Imolecule: An Embeddable webGL Molecule Viewer and File Format Converter
|
2013
|
||
google,我,萨娜
|
方华
|
2006
|
View Paper |
Using thematic analysis in psychology
|
2006
|
||
Notebooks CHI EA ’24, May 11–16, 2024,
|
|||
Computational Notebooks CHI EA ’24, May 11–16, 2024, Honolulu, HI, USA of Geospatial Networks, Flows and Movement (MoVis)
|
|||
2022. Building (Easy-To-Adopt) Software While Doing Visualization Research
|
|||
Design Strategies and Opportunities for Interactive Visualization
|
|||
2022. ExploringD3Implementation Challenges on Stack Overflow
|
|||
2023.VISGRADER:Automatic GradingofD3Visualizations
|
|||
CHI EA ’24, May 11–16, 2024, Honolulu, HI, USA
|
|||
Ipytree: A Tree Widget using Jupyter-widgets protocol and jsTree
|
|||
Evidently: Evaluate and monitor ML models from validation to production
|
|||
Datapane: Build full-stack data apps in 100% Python
|
|||
Interactive plotting for Python
|
|||
2023. Nbtutor: Visualize Python Code Execution
|
|||
2022. Cytoscape/Cytoscape
|
|||
2022. Module for Embedding Igv.Js in
|
Showing first page preview. Click "Open Full PDF" to view the complete paper.
Chenglong Wang, Andrew M. McNutt, Steven M. Drucker, Robert A. DeLine
Published: 2023-01-27
Arvind Satyanarayan, Dylan Wootton, Amy Rae Fox, Evan Peck
Published: 2024-09-16
Shunan Guo, Chen Chen, Ryan Rossi, Zhicheng Liu, Eunyee Koh, Jane Hoffswell, Fan Du, Yeuk-Yin Chan
Published: 2023-08-22
Neil A. Ernst, Derek Robinson, Enrique Larios Vargas, Margaret-Anne D. Storey
Published: 2022-07-20
You need to log in to post a comment.
Your comment contains inappropriate language.
Are you sure you want to remove this tag?
Someone just favorited a paper!
Comments (0)