Publication
Metrics
AI Quick Summary
This paper explores the superradiant phase transition driven by cavity-assisted dynamical spin-orbit coupling, revealing quantum phenomena like flat spectrum and singularity in the excitation energy spectrum. It examines the effects of atom decay and nonlinear coupling on the phase diagram, highlighting their influence on the transition's symmetry and singularity.
Paper Preview
Abstract
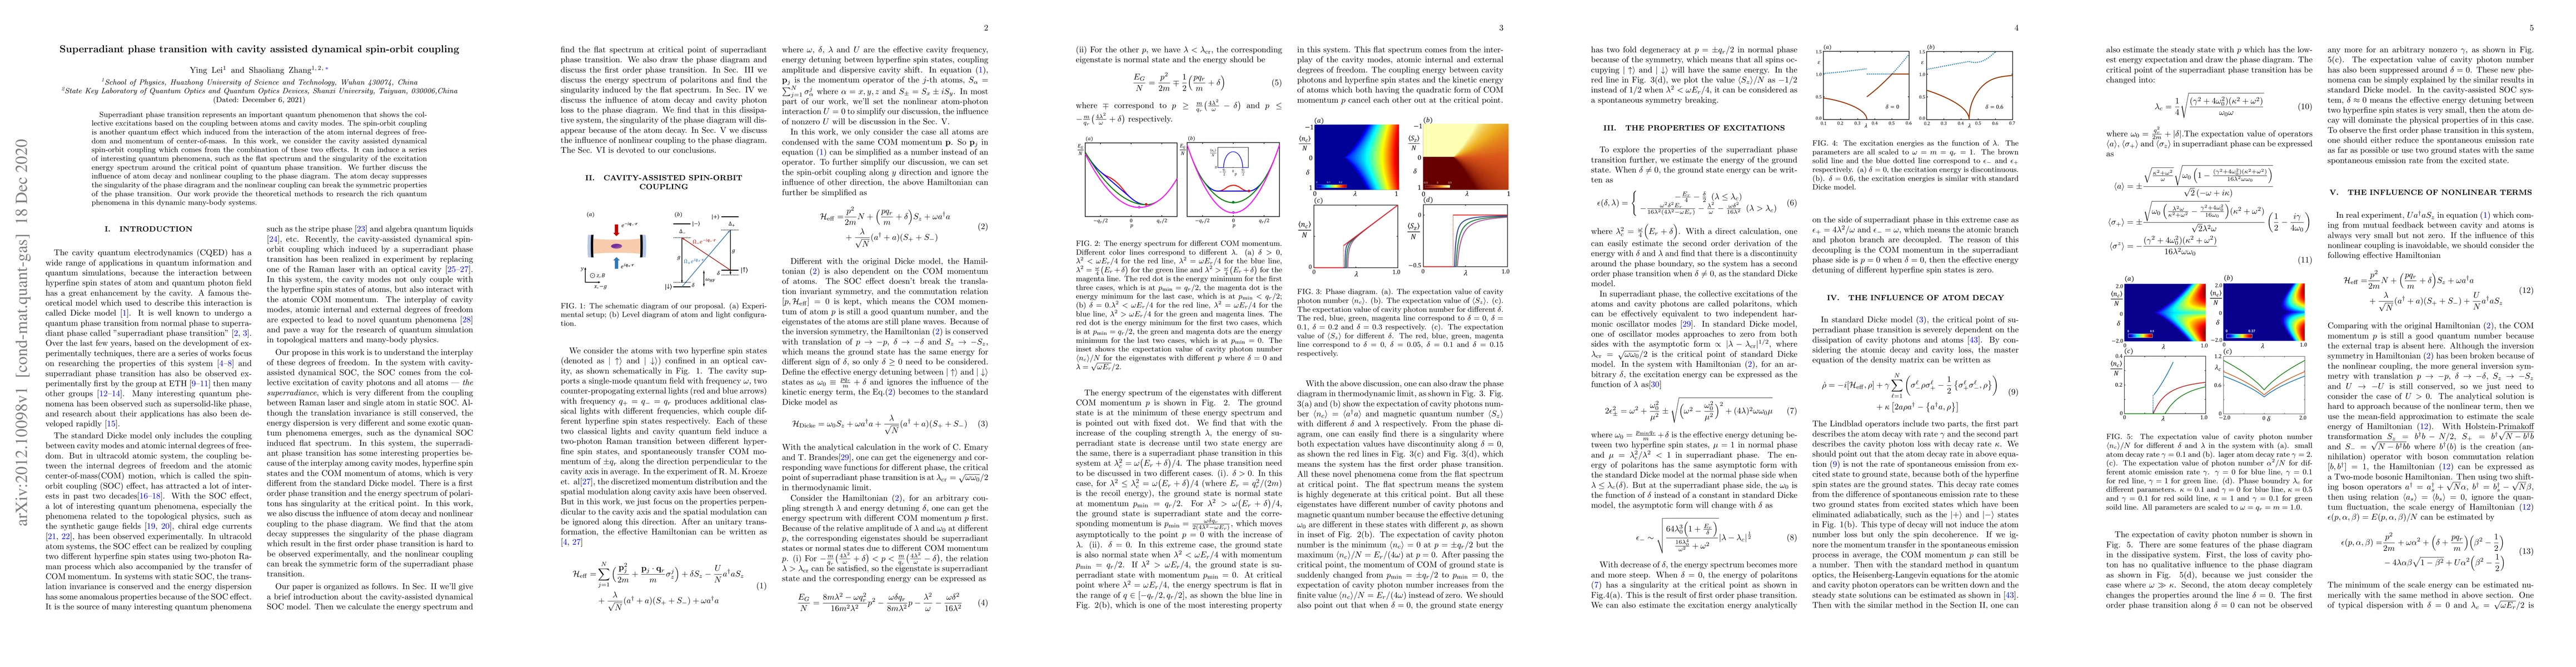
Superradiant phase transition represents an important quantum phenomenon that shows the collective excitations based on the coupling between atoms and cavity modes. The spin-orbit coupling is another quantum effect which induced from the interaction of the atom internal degrees of freedom and momentum of center-of-mass. In this work, we consider the cavity assisted dynamical spin-orbit coupling which comes from the combination of these two effects. It can induce a series of interesting quantum phenomena, such as the flat spectrum and the singularity of the excitation energy spectrum around the critical point of quantum phase transition. We further discuss the influence of atom decay and nonlinear coupling to the phase diagram. The atom decay suppresses the singularity of the phase diagram and the nonlinear coupling can break the symmetric properties of the phase transition. Our work provide the theoretical methods to research the rich quantum phenomena in this dynamic many-body systems.
AI Key Findings
Get AI-generated insights about this paper's methodology, results, significance, and more — seven facets brought into focus.
Impact
Paper Details
Authors
PDF Preview
Key Terms
Citation Network
Current paper (gray), citations (green), references (blue)
Display is limited for performance on very large graphs.
Discussion 0