Publication
Metrics
AI Quick Summary
This paper explores how Surface Brightness Fluctuations (SBF) serve as indicators of stellar populations in galaxies, with different bandpasses revealing various evolutionary stages. Multi-band SBF studies enhance our understanding of galaxy stellar populations, while SBF in the near-IR spectrum is particularly useful for distance measurements.
Paper Preview
Abstract
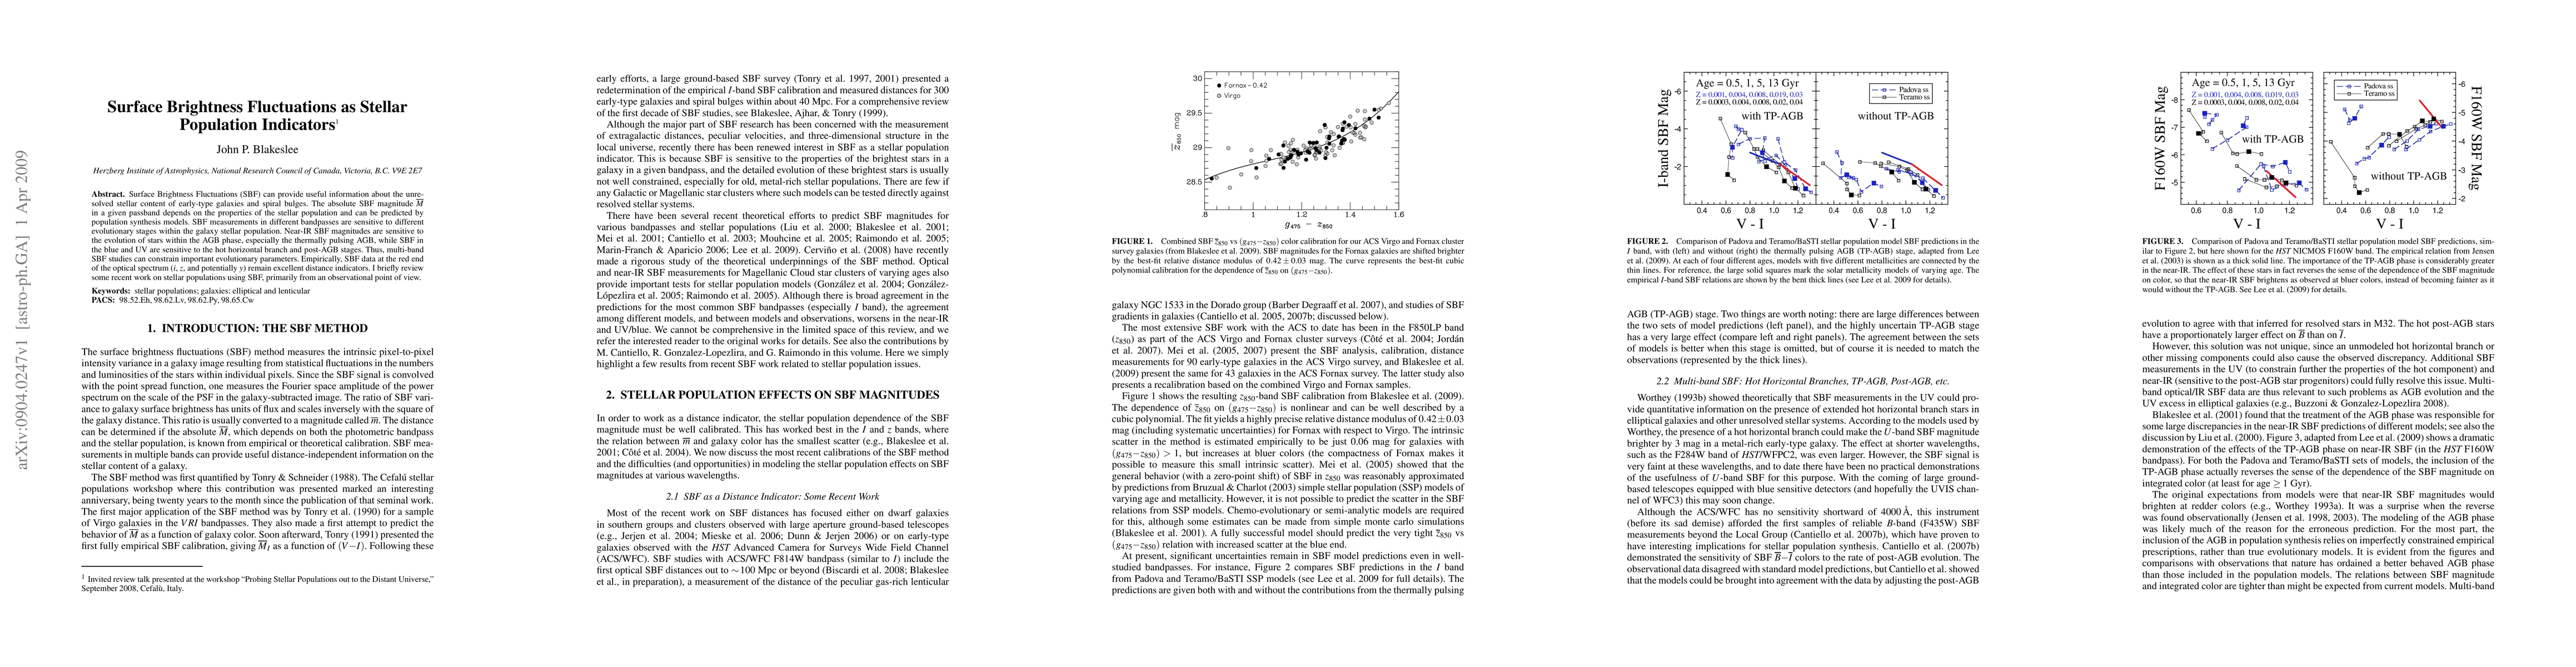
Surface Brightness Fluctuations (SBF) can provide useful information about the unresolved stellar content of early-type galaxies and spiral bulges. The absolute SBF magnitude Mbar in a given passband depends on the properties of the stellar population and can be predicted by population synthesis models. SBF measurements in different bandpasses are sensitive to different evolutionary stages within the galaxy stellar population. Near-IR SBF magnitudes are sensitive to the evolution of stars within the AGB phase, especially the thermally pulsing AGB, while SBF in the blue and UV are sensitive to the hot horizontal branch and post-AGB stages. Thus, multi-band SBF studies can constrain important evolutionary parameters. Empirically, SBF data at the red end of the optical spectrum (i, z, and potentially y) remain excellent distance indicators. I briefly review some recent work on stellar populations using SBF, primarily from an observational point of view.
AI Key Findings
Get AI-generated insights about this paper's methodology, results, significance, and more — seven facets brought into focus.
Impact
Paper Details
PDF Preview
Key Terms
Citation Network
Current paper (gray), citations (green), references (blue)
Display is limited for performance on very large graphs.
Discussion 0