Publication
Metrics
AI Quick Summary
This paper identifies "visualization mirages" as silent failures in data visualizations that can mislead analysts, and proposes a conceptual model to describe them. It introduces metamorphic testing as a method to automatically detect these mirages during the visual encoding stage, demonstrating its effectiveness across various chart types.
Paper Preview
Abstract
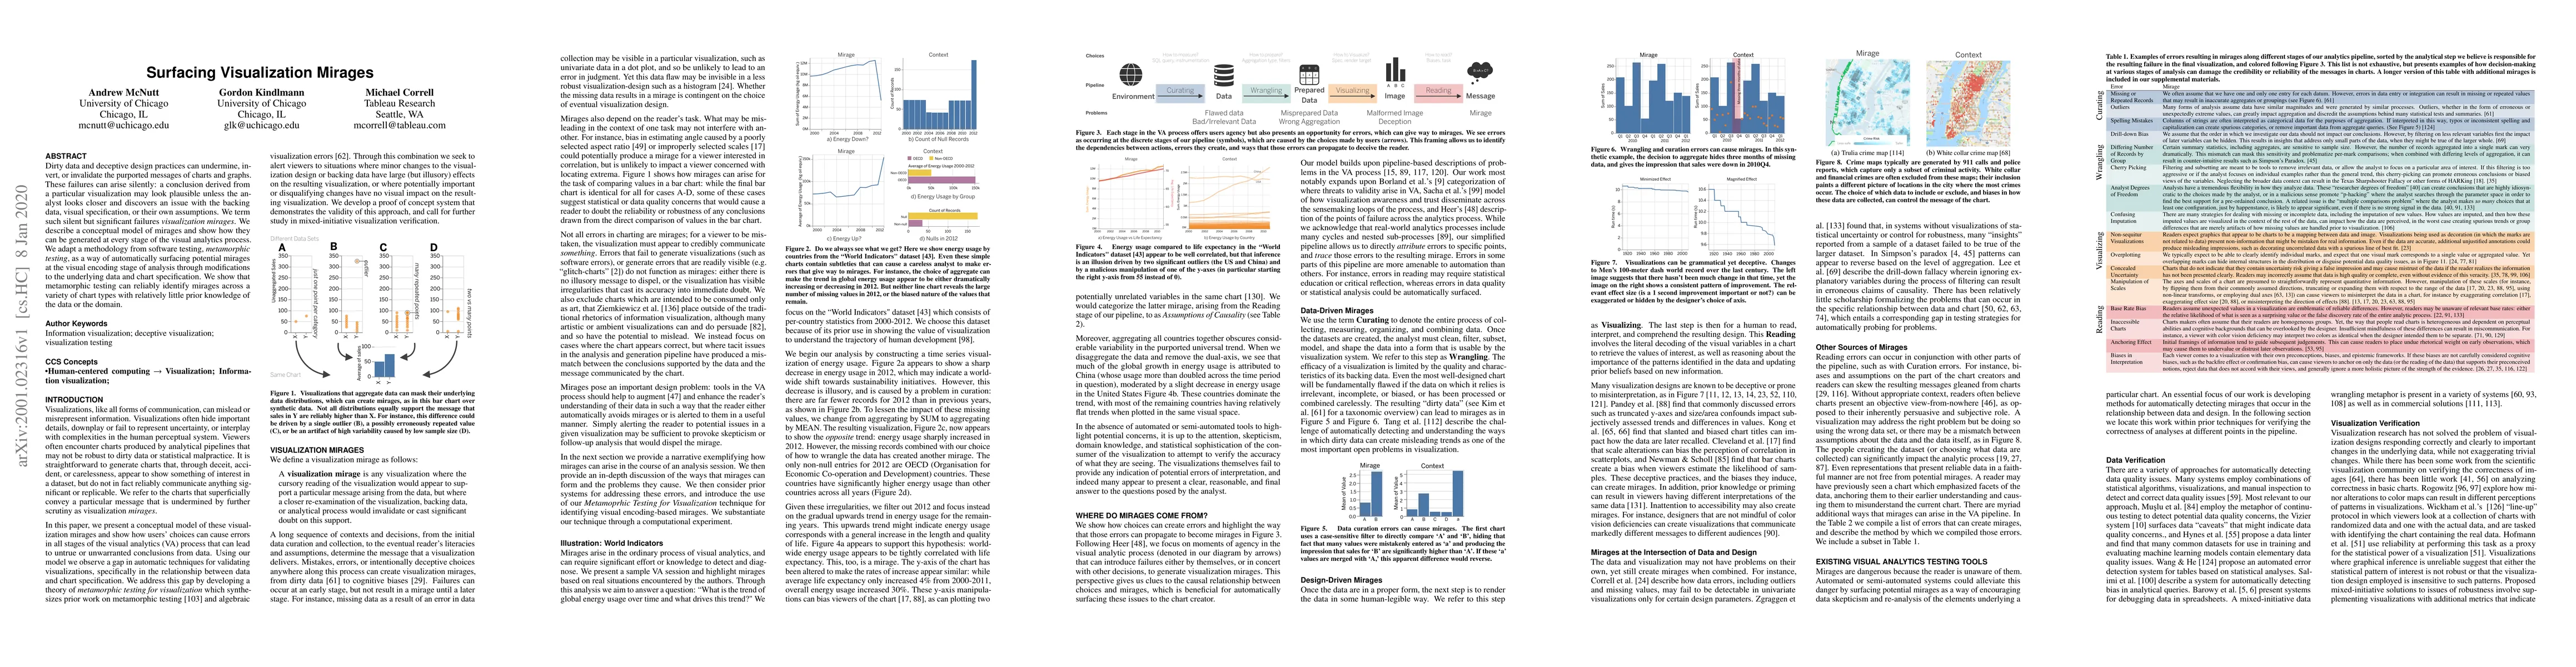
Dirty data and deceptive design practices can undermine, invert, or invalidate the purported messages of charts and graphs. These failures can arise silently: a conclusion derived from a particular visualization may look plausible unless the analyst looks closer and discovers an issue with the backing data, visual specification, or their own assumptions. We term such silent but significant failures "visualization mirages". We describe a conceptual model of mirages and show how they can be generated at every stage of the visual analytics process. We adapt a methodology from software testing, "metamorphic testing", as a way of automatically surfacing potential mirages at the visual encoding stage of analysis through modifications to the underlying data and chart specification. We show that metamorphic testing can reliably identify mirages across a variety of chart types with relatively little prior knowledge of the data or the domain.
AI Key Findings
Get AI-generated insights about this paper's methodology, results, significance, and more — seven facets brought into focus.
Impact
Paper Details
Authors
PDF Preview
Key Terms
Citation Network
Current paper (gray), citations (green), references (blue)
Display is limited for performance on very large graphs.
Discussion 0