Publication
Metrics
AI Quick Summary
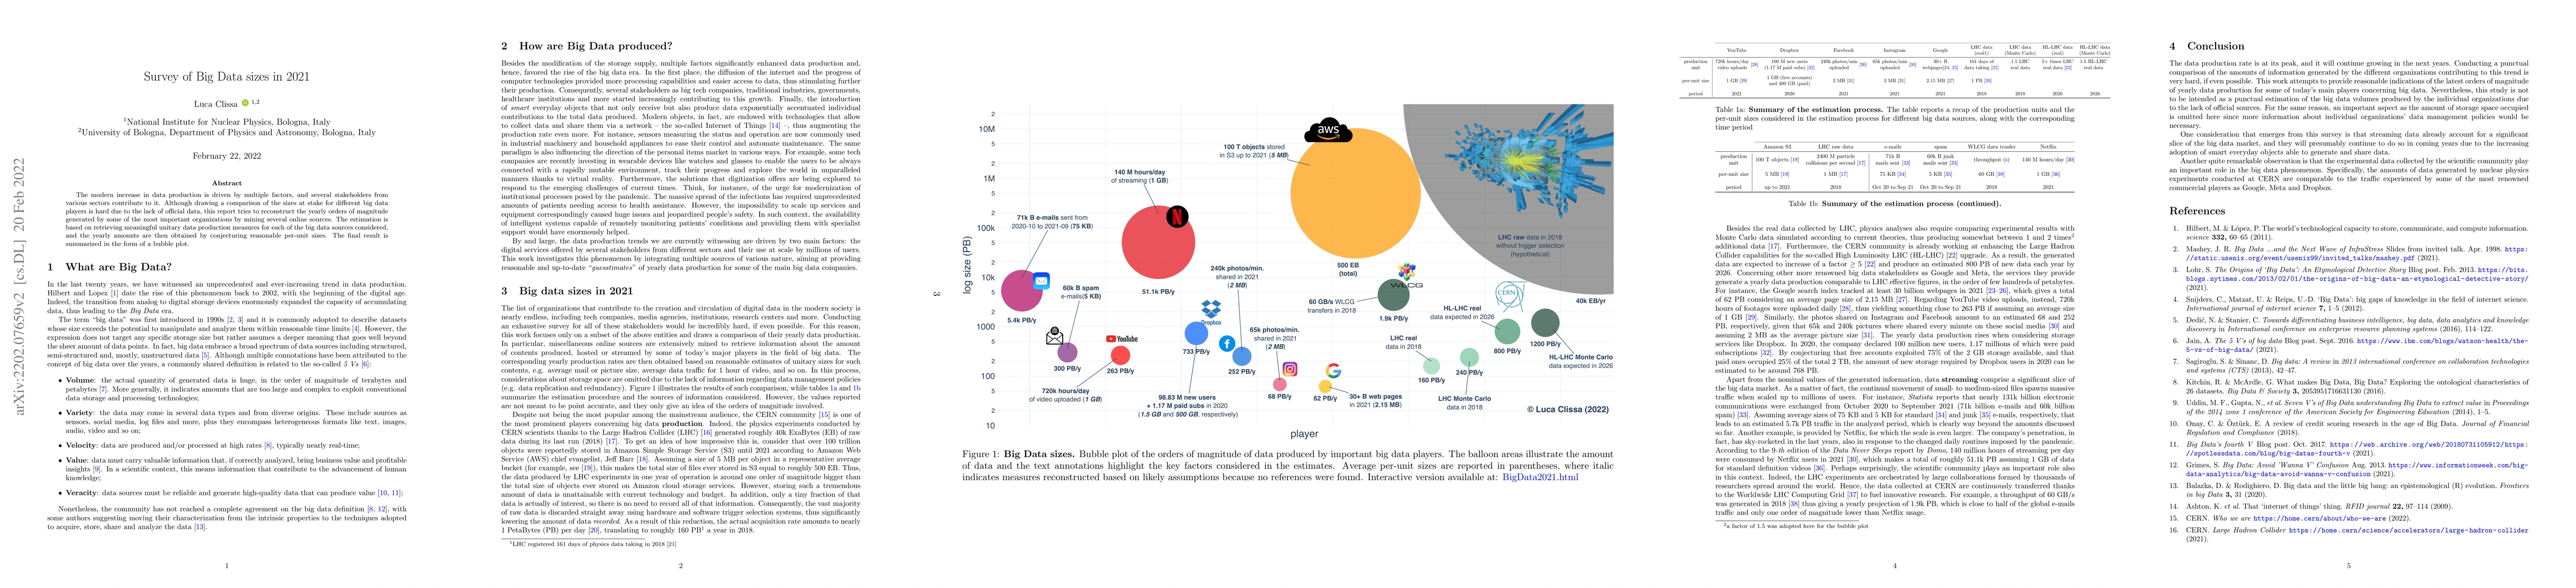
This paper estimates the big data sizes generated by major organizations in 2021 by analyzing online sources and conjecturing per-unit sizes, presenting the results in a bubble plot to compare the yearly orders of magnitude. Despite the lack of official data, the study aims to provide a comparative overview of big data production across different sectors.
Paper Preview
Abstract
The modern increase in data production is driven by multiple factors, and several stakeholders from various sectors contribute to it. Although drawing a comparison of the sizes at stake for different big data players is hard due to the lack of official data, this report tries to reconstruct the yearly orders of magnitude generated by some of the most important organizations by mining several online sources. The estimation is based on retrieving meaningful unitary data production measures for each of the big data sources considered, and the yearly amounts are then obtained by conjecturing reasonable per-unit sizes. The final result is summarized in the form of a bubble plot.
AI Key Findings
Get AI-generated insights about this paper's methodology, results, significance, and more — seven facets brought into focus.
Impact
Paper Details
Authors
PDF Preview
Key Terms
Citation Network
Current paper (gray), citations (green), references (blue)
Display is limited for performance on very large graphs.
Discussion 0