Summary
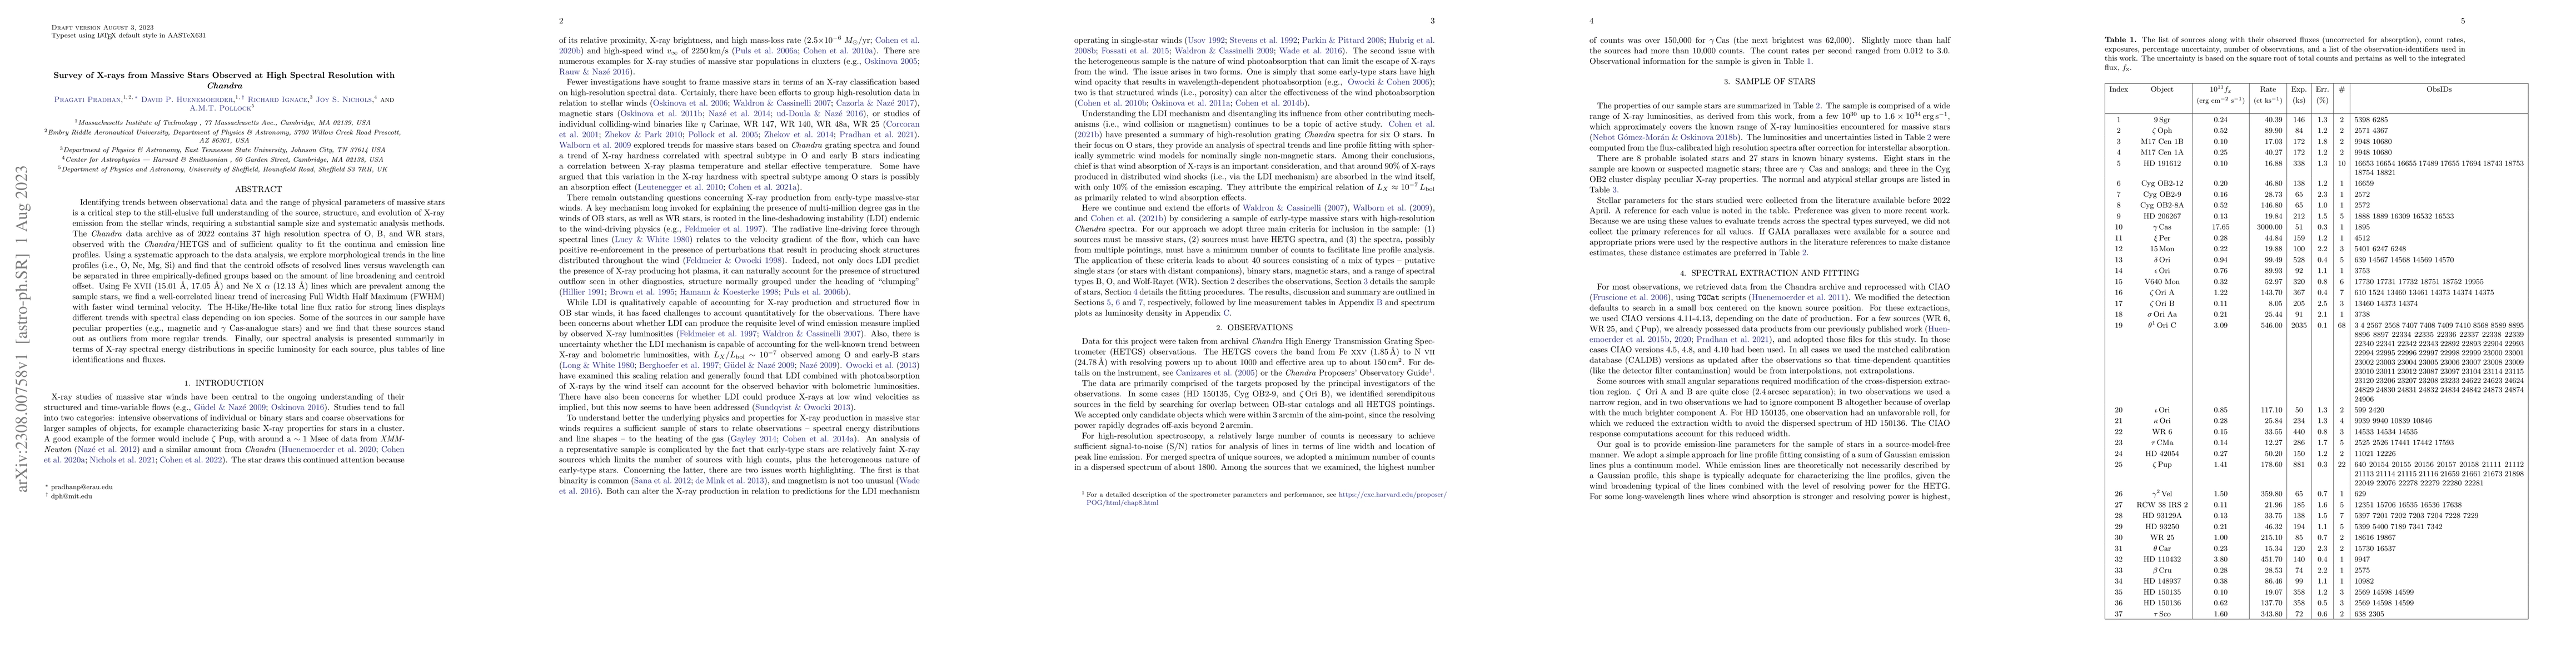
Identifying trends between observational data and the range of physical parameters of massive stars is a critical step to the still-elusive full understanding of the source, structure, and evolution of X-ray emission from the stellar winds, requiring a substantial sample size and systematic analysis methods. The \emph{Chandra} data archive as of 2022 contains 37 high resolution spectra of O, B, and WR stars, observed with the \emph{Chandra}/HETGS and of sufficient quality to fit the continua and emission line profiles. Using a systematic approach to the data analysis, we explore morphological trends in the line profiles (i.e., O, Ne, Mg, Si) and find that the centroid offsets of resolved lines versus wavelength can be separated in three empirically-defined groups based on the amount of line broadening and centroid offset. Using \ion{Fe}{17} (15.01 \AA, 17.05 \AA) and \ion{Ne}{10} $\alpha$ (12.13 \AA) lines which are prevalent among the sample stars, we find a well-correlated linear trend of increasing Full Width Half Maximum (FWHM) with faster wind terminal velocity. The H-like/He-like total line flux ratio for strong lines displays different trends with spectral class depending on ion species. Some of the sources in our sample have peculiar properties (e.g., magnetic and $\gamma$ Cas-analogue stars) and we find that these sources stand out as outliers from more regular trends. Finally, our spectral analysis is presented summarily in terms of X-ray spectral energy distributions in specific luminosity for each source, plus tables of line identifications and fluxes.
AI Key Findings - Failed
Key findings generation failed. Failed to start generation process
Paper Details
PDF Preview
Key Terms
Citation Network
Current paper (gray), citations (green), references (blue)
Display is limited for performance on very large graphs.
Similar Papers
Found 4 papers| Title | Authors | Year | Actions |
|---|
Comments (0)