The study provides a comprehensive summary of the key findings and methodologies, highlighting the need for more personalized approaches to data visualization that account for individual personality traits, cognitive abilities, and visualizations.
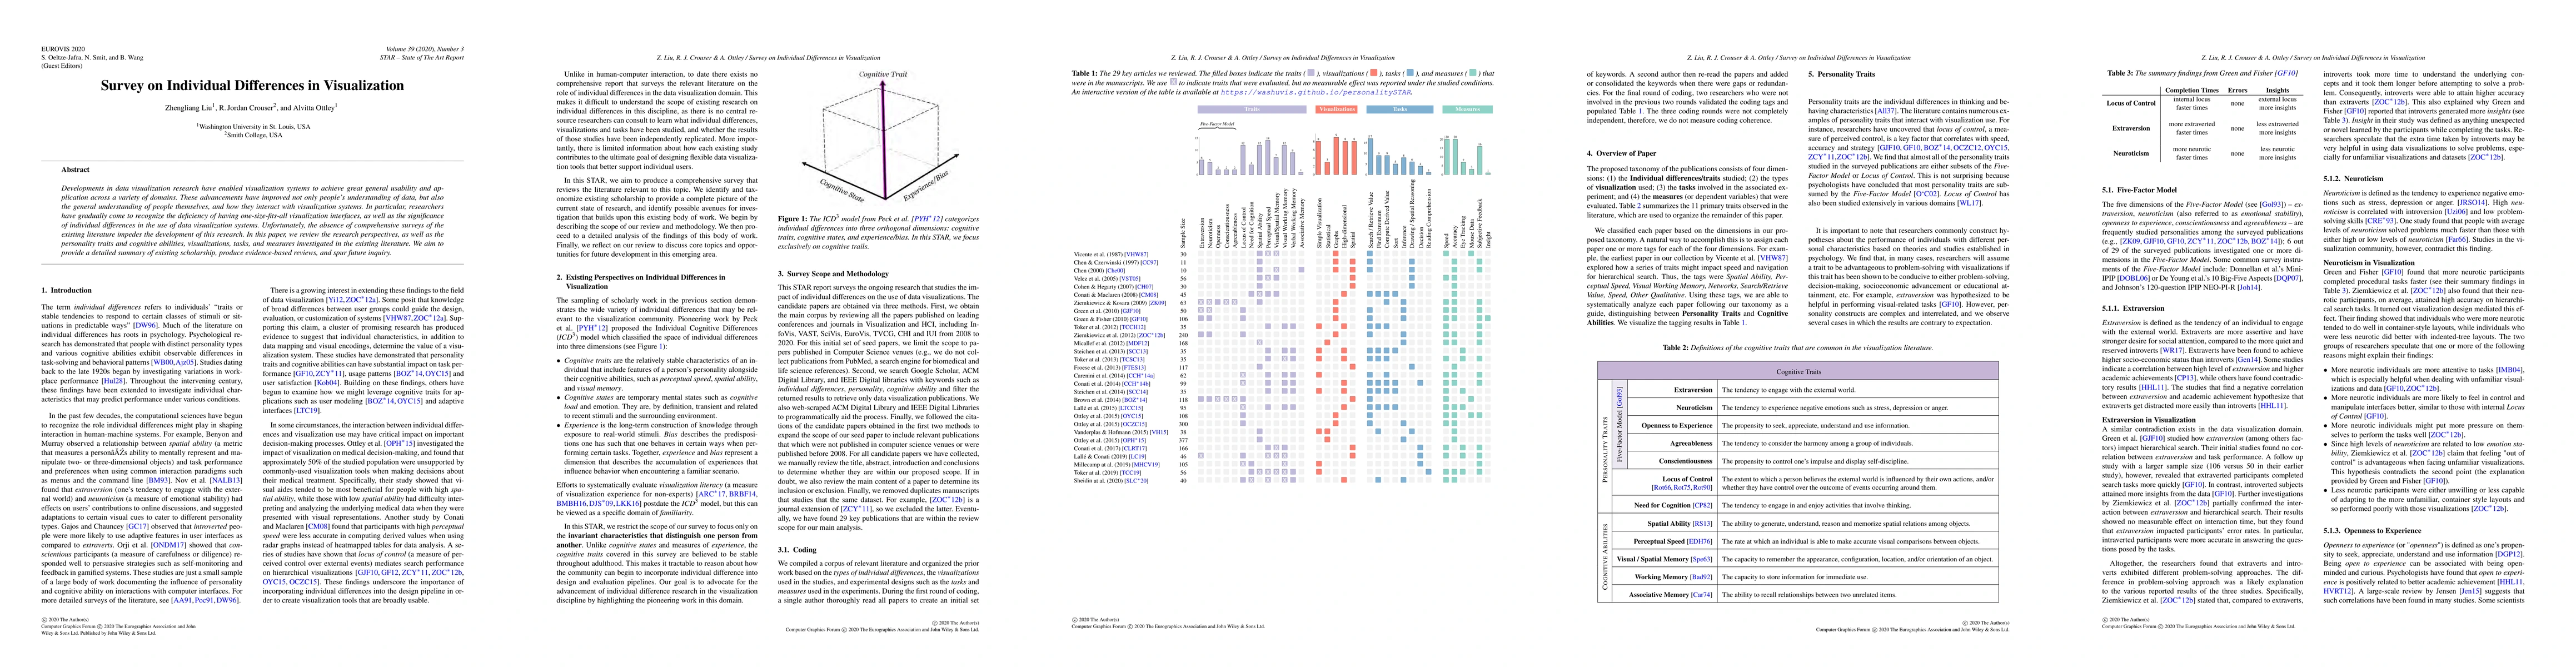
Developments in data visualization research have enabled visualization systems to achieve great general usability and application across a variety of domains. These advancements have improved not only people's understanding of data, but also the general understanding of people themselves, and how they interact with visualization systems. In particular, researchers have gradually come to recognize the deficiency of having one-size-fits-all visualization interfaces, as well as the significance of individual differences in the use of data visualization systems. Unfortunately, the absence of comprehensive surveys of the existing literature impedes the development of this research. In this paper, we review the research perspectives, as well as the personality traits and cognitive abilities, visualizations, tasks, and measures investigated in the existing literature. We aim to provide a detailed summary of existing scholarship, produce evidence-based reviews, and spur future inquiry.
Get AI-generated insights about this paper's methodology, results, and significance.
Current paper (gray), citations (green), references (blue)
Matthew Kay, Yiren Ding, Lane Harrison et al.
János Kertész, Manran Zhu, Taha Yasseri
Title | Authors | Year | Actions |
---|---|---|---|
Toward Personalizable AI Node Graph Creative Writing Support: Insights on Preferences for Generative AI Features and Information Presentation Across Story Writing Processes
|
Hua Xuan Qin, Guangzhi Zhu, Mingming Fan, Pan Hui
|
2025
|
View Paper |
"Piecing Data Connections Together Like a Puzzle": Effects of Increasing Task Complexity on the Effectiveness of Data Storytelling Enhanced Visualisations
|
M. Milesi, Paola Mejia-Domenzain, Laura Brandl, Vanessa Echeverría, Yueqiao Jin, D. Gašević, Yi-Shan Tsai, Tanja Käser, Roberto Martínez-Maldonado
|
2025
|
View Paper |
Uncovering How Scatterplot Features Skew Visual Class Separation
|
S. Bae, Takanori Fujiwara, Chin Tseng, D. Szafir
|
2025
|
View Paper |
Intra, Extra, Read all about it! How Readers Interpret Visualizations with Intra- and Extratextual Information
|
Alyxander Burns, Claudia Gonzalez-Vazquez
|
2025
|
View Paper |
Trustworthy by Design: The Viewer's Perspective on Trust in Data Visualization
|
O. McKinley, Saugat Pandey, Alvitta Ottley
|
2025
|
View Paper |
Toward Filling a Critical Knowledge Gap: Charting the Interactions of Age with Task and Visualization
|
Zack While, Ali Sarvghad
|
2025
|
View Paper |
Leveraging personality as a proxy of perceived transparency in hierarchical visualizations
|
Tomás Alves, Carlota Dias, Daniel Gonçalves, S. Gama
|
2025
|
View Paper |
How to teach Bayesian reasoning: An empirical study comparing four different probability training courses
|
Nicole Steib, Theresa Büchter, Andreas Eichler, Karin Binder, Stefan Krauss, Katharina Böcherer-Linder, Markus Vogel, Sven Hilbert
|
2025
|
View Paper |
Color Recommendations Based on Individual Differences
|
Ikuya Morita, Shigeo Takahashi, Yui Komo, Satoshi Nishimura, Masatoshi Arikawa, Kazuo Misue
|
2024
|
View Paper |
The State of the Art in User‐Adaptive Visualizations
|
Fernando J. Yanez, Cristina Conati, Alvitta Ottley, Carolina Nobre
|
2024
|
View Paper |
Incidental visualizations: How complexity factors influence task performance
|
João Moreira, Daniel Mendes, Daniel Gonçalves
|
2024
|
View Paper |
The phantom effect in information visualization
|
Carolina Pereira, Tomás Alves, S. Gama
|
2024
|
View Paper |
The Role of Metacognition in Understanding Deceptive Bar Charts
|
Antonia Schlieder, Jan Rummel, Peter Albers, Filip Sadlo
|
2024
|
View Paper |
Entanglements for Visualization: Changing Research Outcomes through Feminist Theory
|
Derya Akbaba, Lauren Klein, Miriah Meyer
|
2024
|
View Paper |
Motion-Based Visual Encoding Can Improve Performance on Perceptual Tasks with Dynamic Time Series
|
Songwen Hu, Ouxun Jiang, Jeffrey Riedmiller, Cindy Xiong Bearfield
|
2024
|
View Paper |
Talk to the Wall: The Role of Speech Interaction in Collaborative Visual Analytics
|
Gabriela Molina León, A. Bezerianos, Olivier Gladin, Petra Isenberg
|
2024
|
View Paper |
Building and Eroding: Exogenous and Endogenous Factors that Influence Subjective Trust in Visualization
|
R. Crouser, Syrine Matoussi, Lan Kung, Saugat Pandey, O. McKinley, Alvitta Ottley
|
2024
|
View Paper |
Connections Beyond Data: Exploring Homophily With Visualizations
|
P. Sukumar, Maurizio Porfiri, O. Nov
|
2024
|
View Paper |
AI-Driven Transformation: Revolutionizing Production Management with Machine Learning and Data Visualization
|
Tian Tian, Jiahao Deng, Bowen Zheng, Xikun Wan, Jindi Lin
|
2024
|
View Paper |
PREVis: Perceived Readability Evaluation for Visualizations
|
Anne-Flore Cabouat, Tingying He, Petra Isenberg, Tobias Isenberg
|
2024
|
View Paper |
A Visual Comparison interface for educational videos
|
Elena Benedetto, Gabriele Romano, Ilaria Torre, Mario Vallarino, G. Vercelli
|
2024
|
View Paper |
Unleashing the Power of AI: Transforming Marketing Decision-Making in Heavy Machinery with Machine Learning, Radar Chart Simulation, and Markov Chain Analysis
|
Tian Tian, Jiahao Deng
|
2024
|
View Paper |
The Dance of Logic and Unpredictability: Examining the Predictability of User Behavior on Visual Analytics Tasks
|
Alvitta Ottley
|
2024
|
View Paper |
Large Language Models for Robotics: Opportunities, Challenges, and Perspectives
|
Jiaqi Wang, Zihao Wu, Yiwei Li, Hanqi Jiang, Peng Shu, Enze Shi, Huawen Hu, Chong-Yi Ma, Yi-Hsueh Liu, Xuhui Wang, Yincheng Yao, Xuan Liu, Huaqin Zhao, Zheng Liu, Haixing Dai, Lin Zhao, Bao Ge, Xiang Li, Tianming Liu, Shu Zhang
|
2024
|
View Paper |
Studying the resiliency of the anchoring bias to locus of control in visualization
|
Tomás Alves, Ricardo Velhinho, J. Henriques-Calado, Daniel Gonçalves, S. Gama
|
2023
|
View Paper |
Towards Artificial General Intelligence (AGI) in the Internet of Things (IoT): Opportunities and Challenges
|
Fei Dou, Jin Ye, Geng Yuan, Qin Lu, Wei Niu, Haijian Sun, Le Guan, Guoyu Lu, Gengchen Mai, Ninghao Liu, Jin Lu, Zheng Liu, Zihao Wu, Chenjiao Tan, Shaochen Xu, Xianqiao Wang, Guoming Li, Lilong Chai, Sheng Li, Jin Sun, Hongyue Sun, Yunli Shao, Changying Li, Tianming Liu, Wenzhan Song
|
2023
|
View Paper |
Do You Trust What You See? Toward A Multidimensional Measure of Trust in Visualization
|
Saugat Pandey, O. McKinley, R. Crouser, Alvitta Ottley
|
2023
|
View Paper |
: A Cluster Ambiguity Measure for Estimating Perceptual Variability in Visual Clustering
|
Hyeon Jeon, Ghulam Jilani Quadri, Hyunwoo Lee, P. Rosen, D. Szafir, Jinwook Seo
|
2023
|
View Paper |
Impact of incidental visualizations on primary tasks
|
João Moreira, Daniel Mendes, Daniel Gonçalves
|
2023
|
View Paper |
Human-centered Information Visualization Adaptation Engine
|
P. Andreou, Christos Amyrotos, Panagiotis Germanakos, I. Polycarpou
|
2023
|
View Paper |
Human–Computer Collaboration for Visual Analytics: an Agent‐based Framework
|
S. Monadjemi, Mengtian Guo, D. Gotz, R. Garnett, Alvitta Ottley
|
2023
|
View Paper |
Exploring Chart Question Answering for Blind and Low Vision Users
|
Jiho Kim, Arjun Srinivasan, N. Kim, Yea-Seul Kim
|
2023
|
View Paper |
“Explain What a Treemap is”: Exploratory Investigation of Strategies for Explaining Unfamiliar Chart to Blind and Low Vision Users
|
Gye-Gyoung Kim, Jiho Kim, Yea-Seul Kim
|
2023
|
View Paper |
Mini‐VLAT: A Short and Effective Measure of Visualization Literacy
|
Saugat Pandey, Alvitta Ottley
|
2023
|
View Paper |
Catalogue Visu: a Tool for Fast Visualization Prototyping
|
Jérémy Wambecke, Ivan Logre, Amandine Murgue
|
2023
|
View Paper |
Why Combining Text and Visualization Could Improve Bayesian Reasoning: A Cognitive Load Perspective
|
Melanie Bancilhon, AJ Wright, Sunwoo Ha, Jordan Crouser, Alvitta Ottley
|
2023
|
View Paper |
Exploring the role of conscientiousness on visualization-supported decision-making
|
Tomás Alves, Tiago Delgado, J. Henriques-Calado, Daniel Gonçalves, S. Gama
|
2023
|
View Paper |
The Risks of Ranking: Revisiting Graphical Perception to Model Individual Differences in Visualization Performance
|
Russell Davis, Xiaoying Pu, Yiren Ding, Brian D. Hall, Karen Bonilla, Mi Feng, M. Kay, Lane Harrison
|
2022
|
View Paper |
Towards conscientiousness-based graphical user interface design guidelines
|
Tomás Alves, daniel. t. nunes, D. Gonçalves, J. Henriques-Calado, S. Gama
|
2022
|
View Paper |
Examining User Preferences based on Personality Factors in Graphical User Interface Design
|
Tomás Alves, D. Gonçalves, S. Gama, J. Henriques-Calado
|
2022
|
View Paper |
How neuroticism and locus of control affect user performance in high-dimensional data visualization
|
Tiago Delgado, Tomás Alves, S. Gama
|
2022
|
View Paper |
How Personality and Visual Channels Affect Insight Generation
|
Tomás Alves, Carlota Dias, D. Gonçalves, S. Gama, J. Henriques-Calado
|
2022
|
View Paper |
A Unified Comparison of User Modeling Techniques for Predicting Data Interaction and Detecting Exploration Bias
|
Sunwoo Ha, S. Monadjemi, R. Garnett, Alvitta Ottley
|
2022
|
View Paper |
Perception! Immersion! Empowerment!: Superpowers as Inspiration for Visualization
|
Wesley Willett, Bon Adriel Aseniero, Sheelagh Carpendale, Pierre Dragicevic, Yvonne Jansen, L. Oehlberg, Petra Isenberg
|
2021
|
View Paper |
Professional Differences: A Comparative Study of Visualization Task Performance and Spatial Ability Across Disciplines
|
K. Hall, Anthony Kouroupis, A. Bezerianos, D. Szafir, C. Collins
|
2021
|
View Paper |
Adaptive Visualizations for Enhanced Data Understanding and Interpretation
|
Christos Amyrotos
|
2021
|
View Paper |
Human-centred Persona Driven Personalization in Business Data Analytics
|
Christos Amyrotos, P. Andreou, Panagiotis Germanakos
|
2021
|
View Paper |
Gaze-Driven Links for Magazine Style Narrative Visualizations
|
Sébastien Lallé, Tiffany Wu, C. Conati
|
2020
|
View Paper |
Exploring How Personality Models Information Visualization Preferences
|
Tomás Alves, Bárbara Ramalho, J. Henriques-Calado, D. Gonçalves, S. Gama
|
2020
|
View Paper |
Computers & Graphics How neuroticism and locus of control a ff ect user performance in high-dimensional data visualization
|
Tiago Delgado, Tomás Alves, S. Gama
|
2022
|
View Paper |
The Role of Cognitive Load and Individual Differences When Interpreting Human-Resource Data Visualizations
|
Zachary B. Hesson
|
2021
|
View Paper |
Cognitive Style's Effects on User Task Performance in Network Visualisations
|
Nikita Dev Lomov, Weidong Huang, Jing Luo, Q. Nguyen
|
2021
|
View Paper |
Interface Design and Task Difficulty Impact ML-Assisted Visual Data Foraging
|
S. Monadjemi, Sunwoo Ha, Quan Nguyen, Henry Chai, R. Garnett, Alvitta Ottley
|
2021
|
View Paper |
The Effect of Neuroticism on Trust Perception of Time Series Visualizations
|
Carlota Dias
|
2021
|
View Paper |
ConsciVis: Exploring the Effect of User-Based Preferences in Information Visualisation
|
Bárbara Ramalho
|
2020
|
View Paper |
Investigating the Role of Locus of Control in Moderating Complex Analytic Workflows
|
R. Crouser, Alvitta Ottley, K. Swanson, Ananda Montoly
|
2020
|
View Paper |
Leveraging Conscientiousness-Based Preferences in Information Visualization Design
|
View Paper |
Comments (0)