SUrvival Control Chart EStimation Software in R: the success package
Publication
Metrics
AI Quick Summary
The R package success facilitates the construction of risk-adjusted control charts for monitoring survival outcomes in statistical processes, particularly in medical settings. It includes functions to determine control chart parameters and supports both static and interactive visualizations using ggplot2 and plotly.
Paper Preview
Abstract
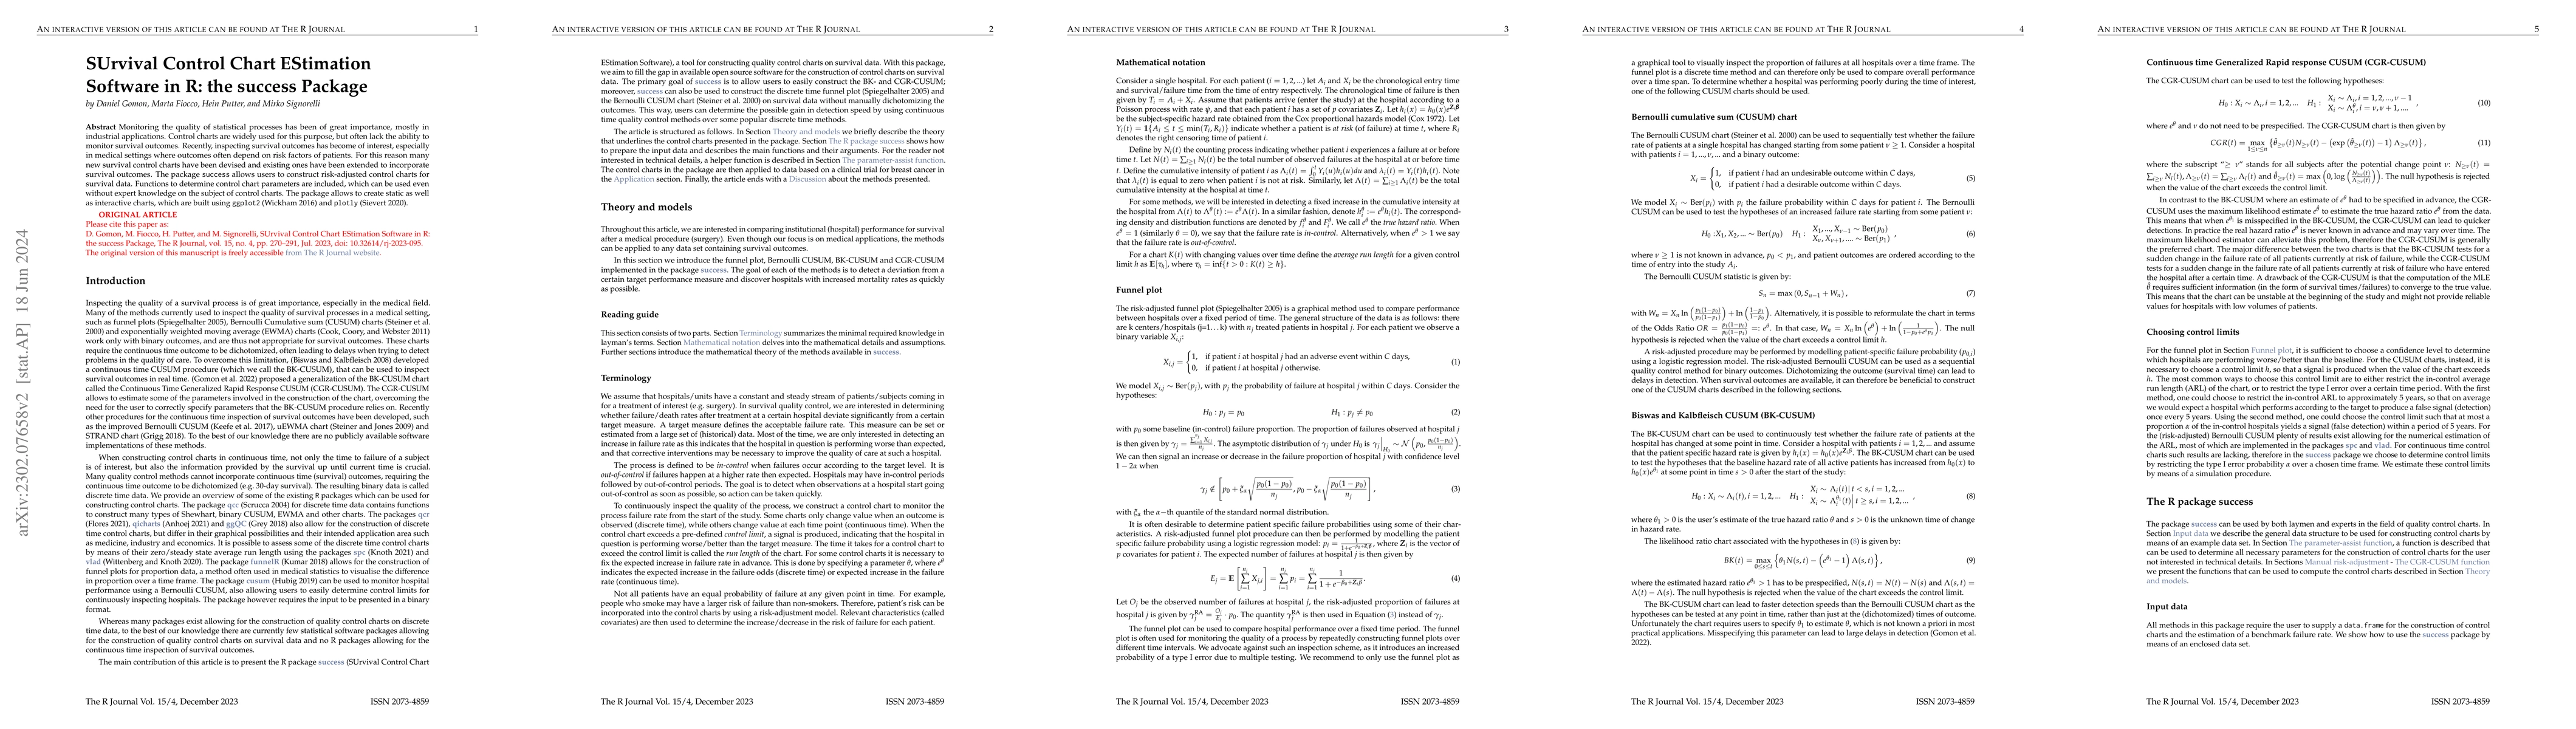
Monitoring the quality of statistical processes has been of great importance, mostly in industrial applications. Control charts are widely used for this purpose, but often lack the possibility to monitor survival outcomes. Recently, inspecting survival outcomes has become of interest, especially in medical settings where outcomes often depend on risk factors of patients. For this reason many new survival control charts have been devised and existing ones have been extended to incorporate survival outcomes. The R package success allows users to construct risk-adjusted control charts for survival data. Functions to determine control chart parameters are included, which can be used even without expert knowledge on the subject of control charts. The package allows to create static as well as interactive charts, which are built using ggplot2 (Wickham 2016) and plotly (Sievert 2020).
AI Key Findings
Get AI-generated insights about this paper's methodology, results, significance, and more — seven facets brought into focus.
Impact
Paper Details
Authors
PDF Preview
Key Terms
Citation Network
Current paper (gray), citations (green), references (blue)
Display is limited for performance on very large graphs.
Discussion 0