Publication
Metrics
Paper Preview
Abstract
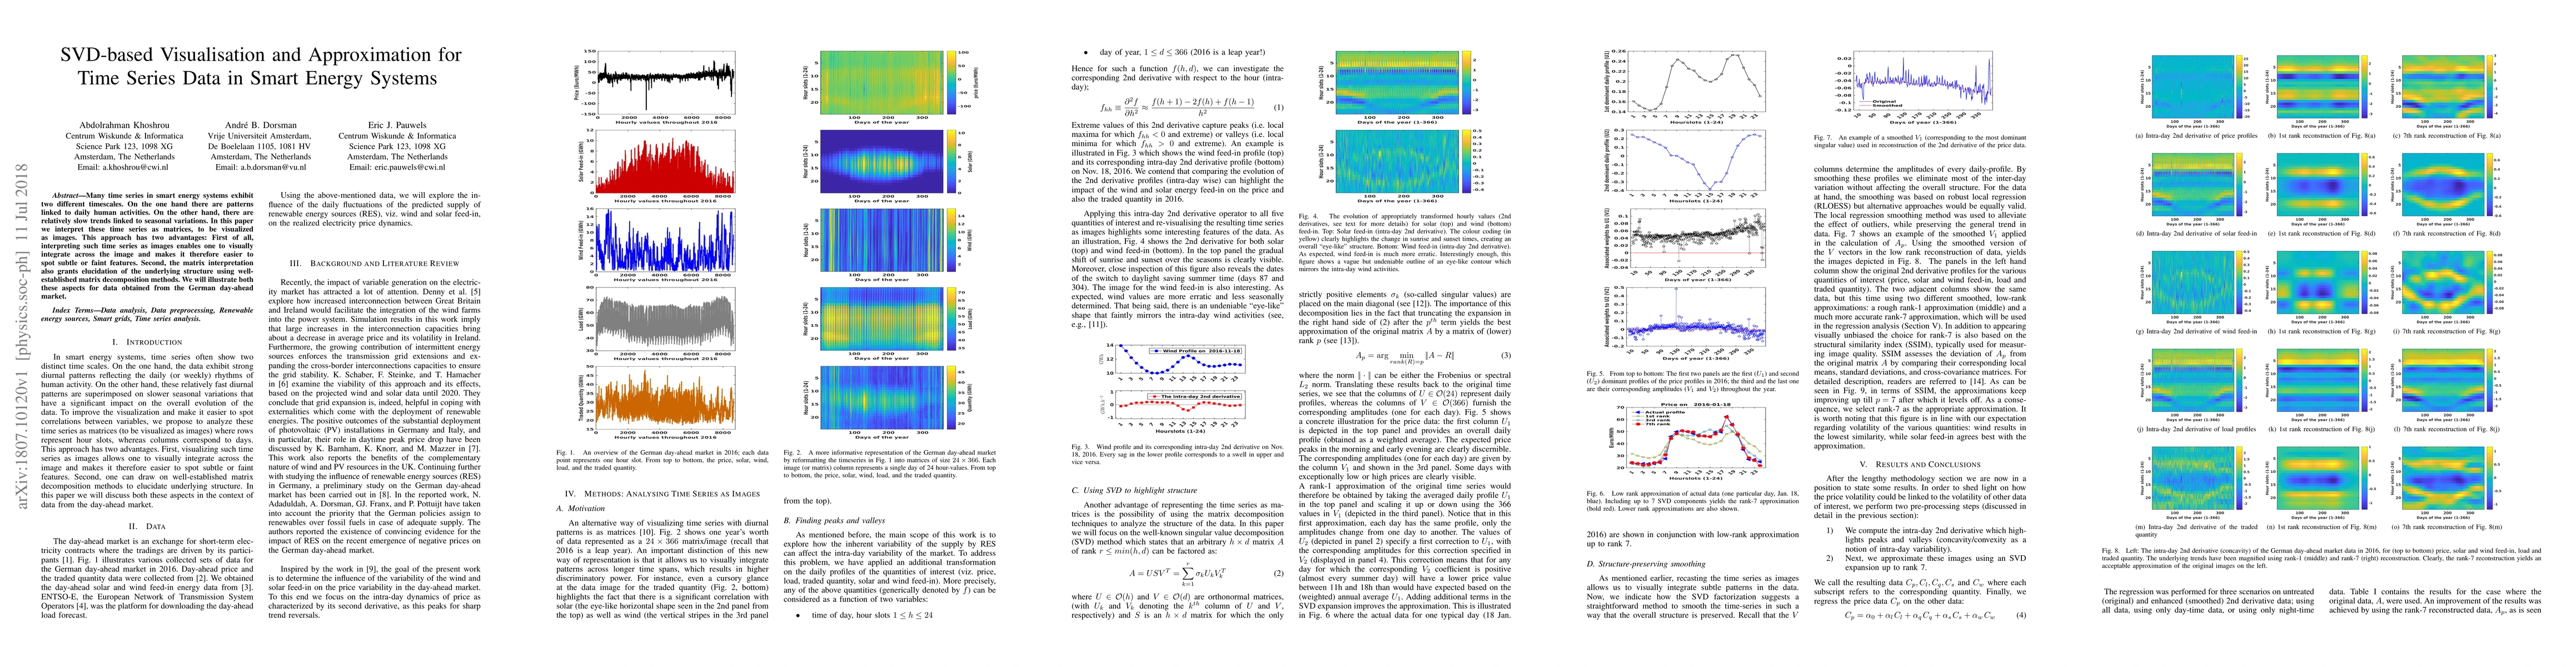
Many time series in smart energy systems exhibit two different timescales. On the one hand there are patterns linked to daily human activities. On the other hand, there are relatively slow trends linked to seasonal variations. In this paper we interpret these time series as matrices, to be visualized as images. This approach has two advantages: First of all, interpreting such time series as images enables one to visually integrate across the image and makes it therefore easier to spot subtle or faint features. Second, the matrix interpretation also grants elucidation of the underlying structure using well-established matrix decomposition methods. We will illustrate both these aspects for data obtained from the German day-ahead market.
AI Key Findings
Get AI-generated insights about this paper's methodology, results, significance, and more — seven facets brought into focus.
Impact
Paper Details
PDF Preview
Key Terms
Citation Network
Current paper (gray), citations (green), references (blue)
Display is limited for performance on very large graphs.
Discussion 0