SVEN: Informative Visual Representation of Complex Dynamic Structure
Publication
Metrics
Paper Preview
Abstract
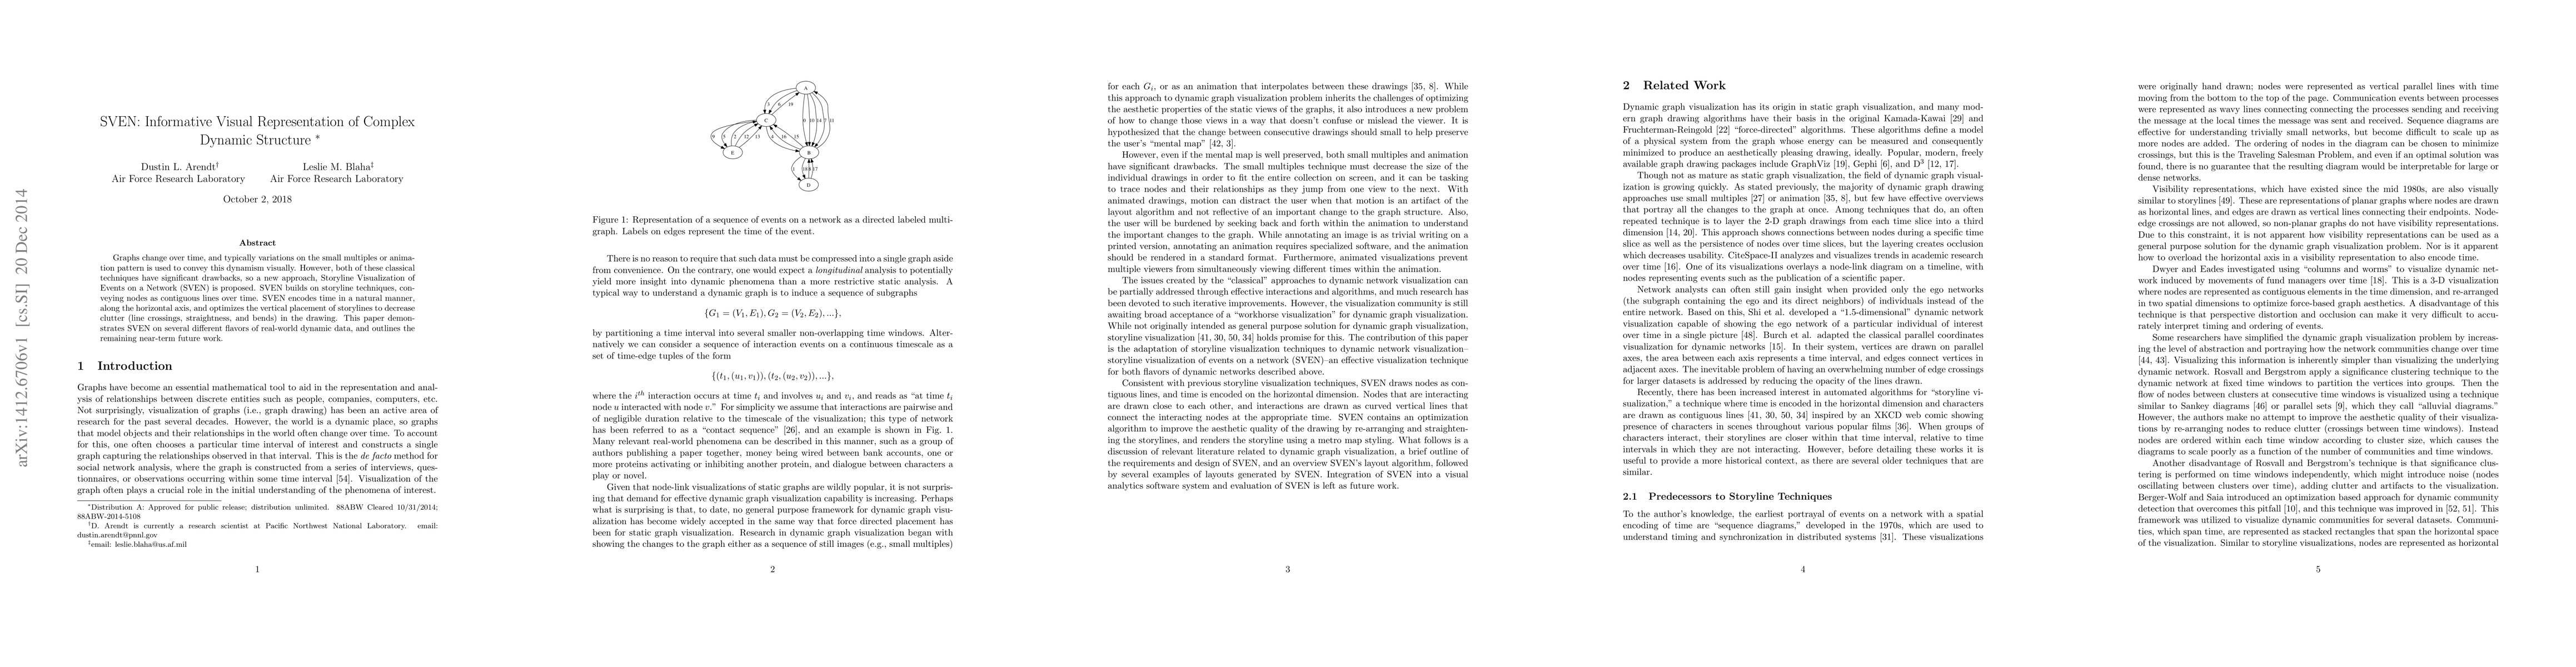
Graphs change over time, and typically variations on the small multiples or animation pattern is used to convey this dynamism visually. However, both of these classical techniques have significant drawbacks, so a new approach, Storyline Visualization of Events on a Network (SVEN) is proposed. SVEN builds on storyline techniques, conveying nodes as contiguous lines over time. SVEN encodes time in a natural manner, along the horizontal axis, and optimizes the vertical placement of storylines to decrease clutter (line crossings, straightness, and bends) in the drawing. This paper demonstrates SVEN on several different flavors of real-world dynamic data, and outlines the remaining near-term future work.
AI Key Findings
Get AI-generated insights about this paper's methodology, results, significance, and more — seven facets brought into focus.
Impact
Paper Details
PDF Preview
Key Terms
Citation Network
Current paper (gray), citations (green), references (blue)
Display is limited for performance on very large graphs.
Discussion 0